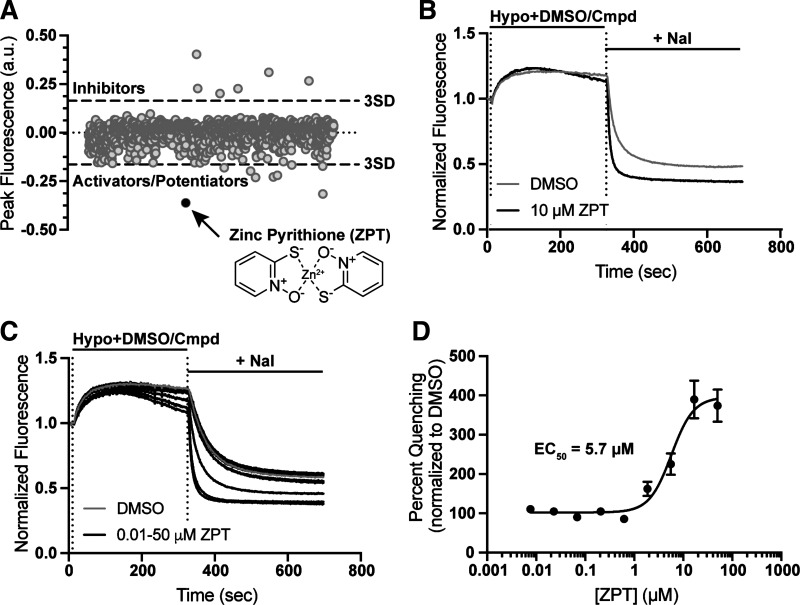
Figure 1.
Discovery of zinc pyrithione (ZPT) in a screen of FDA-approved drugs. A: scatter plot of the 1,184 FDA drug compounds screened. A 3 standard deviation from the mean cutoff was implicated to identify compounds as “hits.” Compounds that slowed the rate of fluorescence quenching had positive values, and compounds that increased fluorescence quenching had negative values. ZPT is depicted as a black dot on the scatter plot and as a chemical structure (inset). B: representative traces of Ozzy-quenching assay with 10 µM ZPT. Traces were normalized to mean of five baseline fluorescent measurements taken at the start of the experiment. Hypotonic solution (130 mOsm) containing DMSO (vehicle) or drug compound was added 10 s after the start of the experiment. After 5-min incubation period, 100 mM NaI is added and fluorescence quenching is observed. Fluorescence measurements were taken throughout the entirety of the experiment. C: representative traces of ZPT dose-dependent fluorescence quenching using the Ozzy-quenching assay. D: ZPT concentration-response curve (CRC) generated from Ozzy-quenching assay using an EC50 osmolality solution (165 mOsm; means ± SE EC50 of 5.7 ± 1.1 µM; n = 13). FDA, Food and Drug Administration.

