Figure 3.

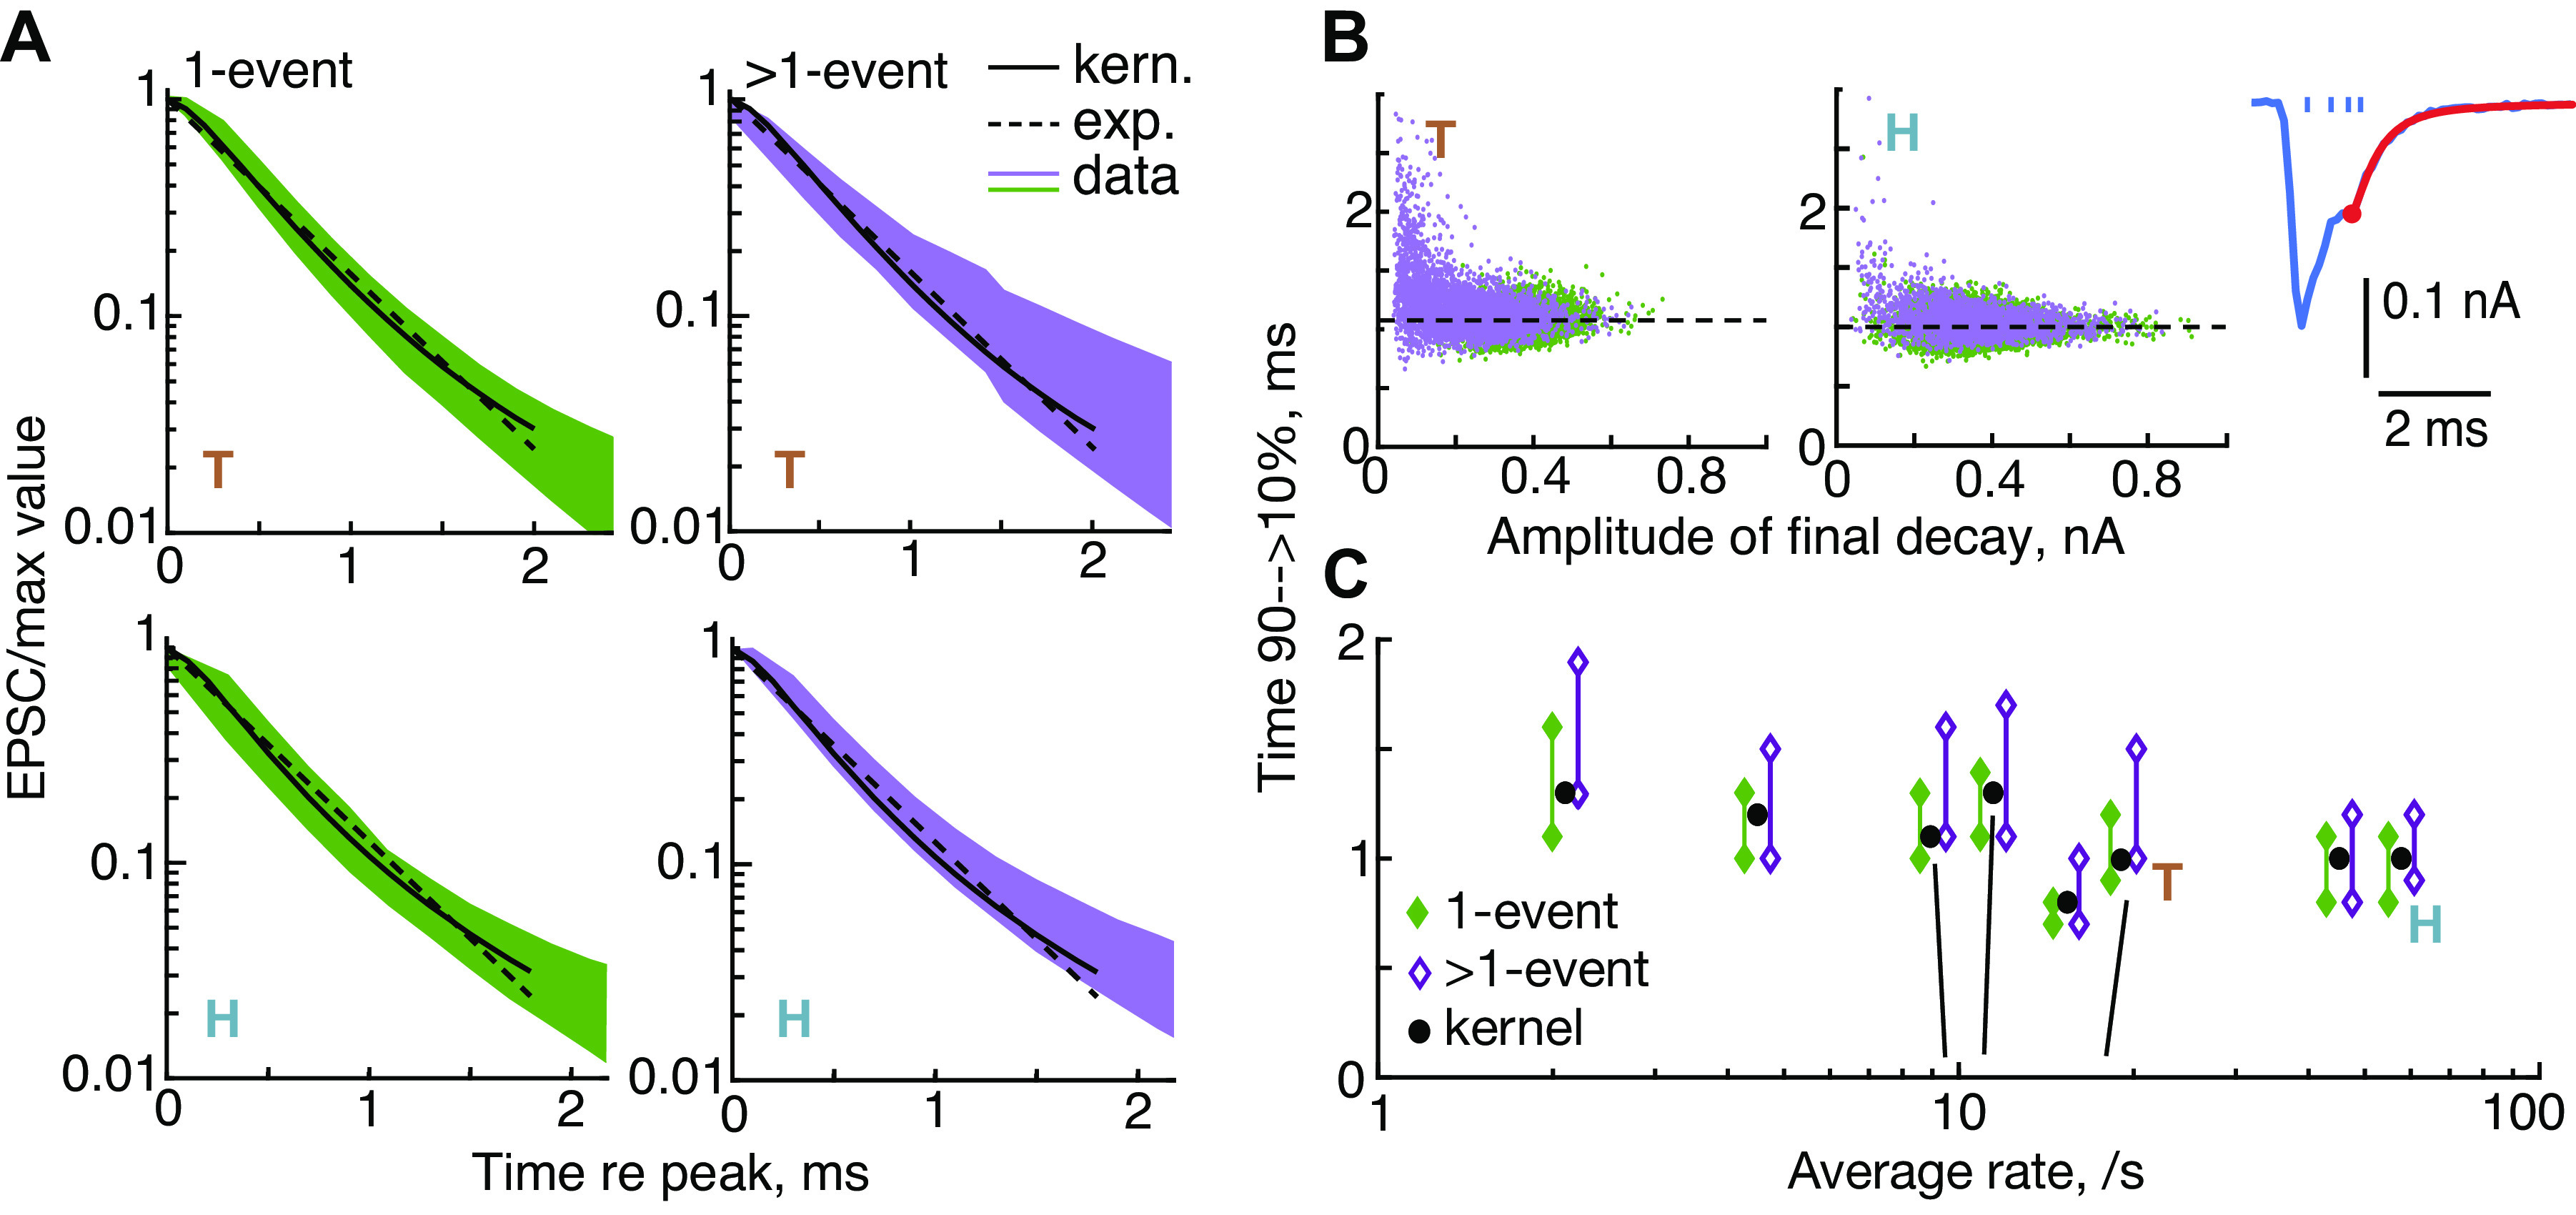
Evidence for linearity: the decay times of excitatory postsynaptic currents (EPSCs) vary little across EPSCs. Times for the EPSC to decay from 90% to 10% of its peak value were estimated from the final decay in the EPSC (the red portion of the EPSC in B, inset, starting at the red circle; the ticks show the calculated event times). A: final decays are plotted from experiments T (top row) and H (bottom row), separately for monophasic (1-event) EPSCs (left column, green) and multiphasic (>1-event) EPSCs (right column, purple). The waveforms are normalized to the beginning of the final decay and inverted for plotting. Solid black lines show the decay of the kernel and the green and purple bands show the 10th to 90th percentiles of the population. The dashed lines show the best single-exponential fits to the kernel. B: final decay times vs. event amplitudes for all EPSCs in experiments T and H; 1 event (green) and >1 event (purple). Dashed lines are the decay times of the kernels (1.08 and 0.97 ms). C: mean decay times for 8 experiments, plotted against the average rate of EPSCs. Each pair of points shows the 10th and 90th percentiles of the values for individual EPSCs. For clarity, the data for experiments with rates between 8 and 20/s are separated slightly along the x-axis. The correct rates are indicated by the black near-vertical lines. A best fit of decay time vs. log rate (slope –0.101, R2 = 0.32, P = 0.08). exp., Exponential; kern., kernel.
