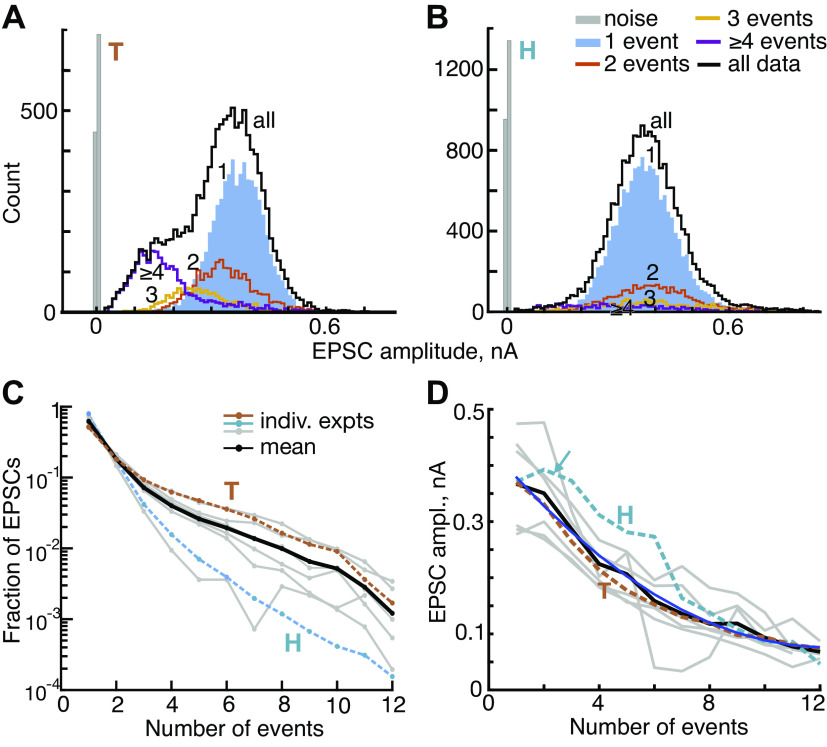
Figure 4.
Amplitudes of excitatory postsynaptic current (EPSC) decrease with the number of events in the EPSC waveform. A and B: histograms of EPSC amplitudes for experiments T and H. EPSCs with 1, 2, 3, and ≥4 events are plotted separately (legend in B). The black histograms show all the data and the gray histograms show noise. In the data for H, the 3 and ≥4 histograms are scaled up by 2 times to make them visible. The amplitudes were measured at the largest negative value of the EPSC. C: the fraction of EPSCs with various numbers of events for 8 experiments (gray and colored lines) and the mean (black). EPSCs with 1 event (monophasic) are most numerous, and the number decreases rapidly and monotonically as the number of events increases. Note that the ordinate is logarithmic. D: mean values of EPSC amplitude vs. the number of events in the EPSC for 8 experiments and the overall mean. The decrease is clear (blue quadratic line, R2 = 0.99, P << 0.001). The arrow points out an exception to the monotonic decrease for experiment H. ampl., Amplitude; indiv. expts, individual experiments.

