Figure 6.
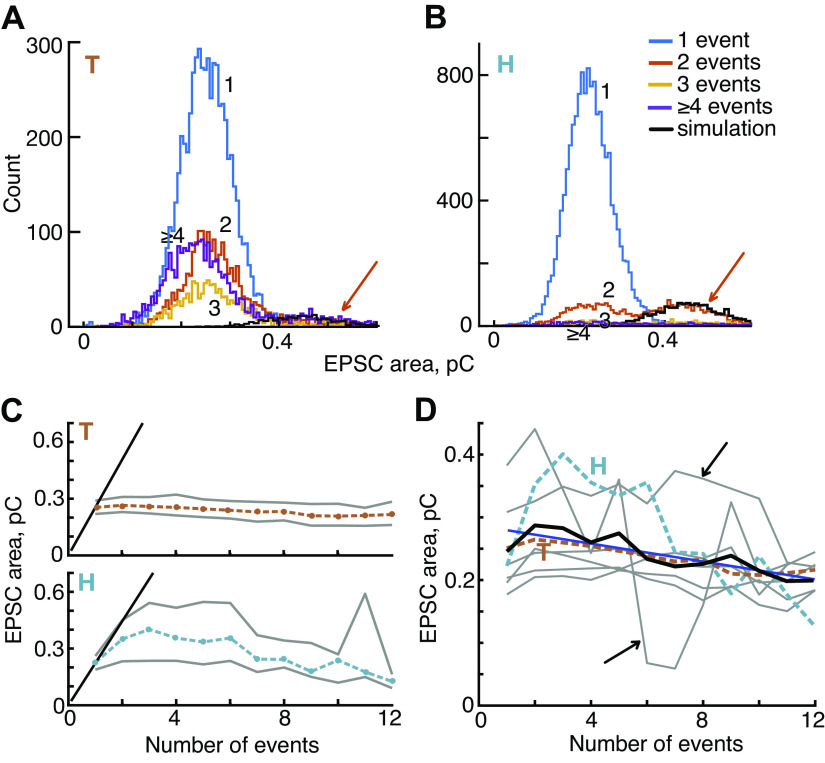
Excitatory postsynaptic currents (EPSC) area declines slightly as the number of events in the EPSC increases. A and B: histograms of EPSC areas for 2 example experiments. Most experiments are similar to T in that areas show a roughly normal distribution which is similar for different numbers of events. In both figures, the histogram for 2-event EPSCs (orange) shows a noticeable second peak (orange arrow) at the expected place if these EPSCs represent overlap of EPSCs from 2 releases of neurotransmitter occurring close together (see text). The black lines show the tail distributions computed using this assumption. C: plots of the mean area (dashed colored lines) plus and minus 1 SD (gray lines) vs. the number of events in the EPSC for T and H. The diagonal black lines at left are the expected behavior if multiple-event EPSCs result entirely from overlapping 1-event EPSCs, so that area increases linearly with the number of events. D: mean EPSC area vs. event number, for 8 experiments (gray and colored lines, as in Fig. 4D); the mean of the 8 experiments is the black line. The data show small but significant declines in area as event count increases (blue line, R2 = 0.68, P = 0.004). Two experiments (black arrows) have few EPSCs for 5 and more events, so are noisy.

