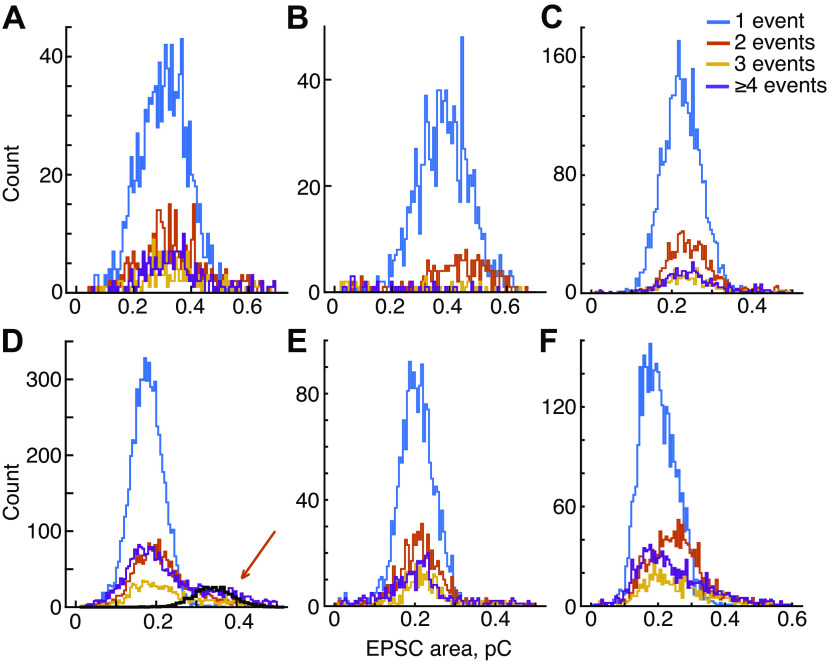
Figure 7.
A–F: distributions of excitatory postsynaptic current (EPSC) area for s6 additional experiments (arranged in the same order as Fig. 5). The distributions for multievent EPSCs usually center around a mean similar to the 1-event histogram, except for B and F. D: data from an experiment with high EPSC rate (45/s); as for experiment H, there is a secondary peak in the 2-event distribution at the place predicted by the simulation of overlapping EPSCs (heavy black plot, orange arrow).

