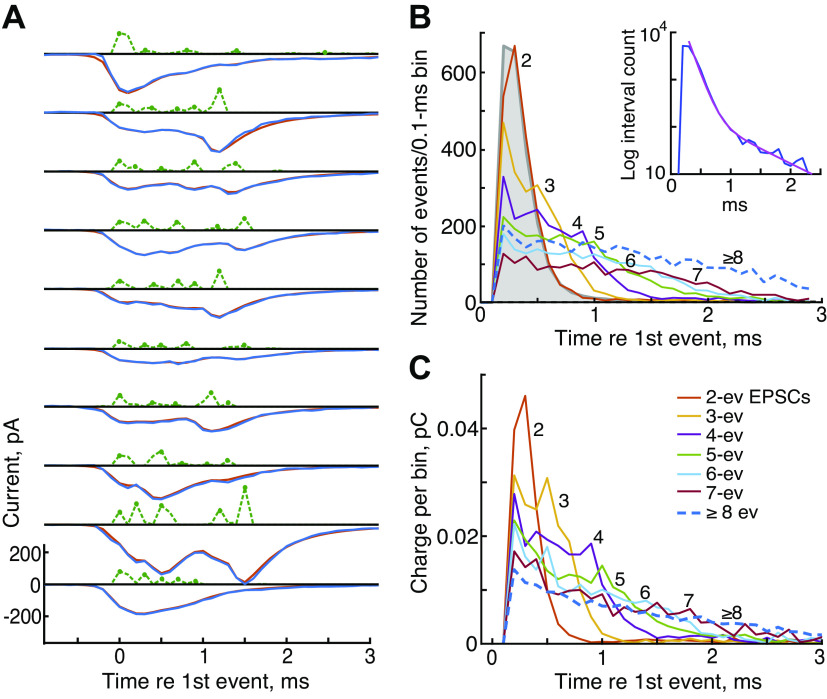
Figure 9.
Release events vary randomly through an excitatory postsynaptic current (EPSC) and occur at roughly the same interevent intervals for larger event numbers. A: waveforms of EPSCs (blue negative signals), kernel amplitudes (green dashed positive), and model fits (red) for ten examples of EPSCs with 5 events (green dots) plotted as in Fig. 1C. Many more examples in the form of this figure can be seen in the Supplemental Data (all Supplemental material is available at https://doi.org/10.12751/g-node.ylt20r). B: histograms of event occurrence times relative to the first event in the EPSC at time 0. The first events in the EPSC are off-scale and are not plotted. Colors and numbers identify data for EPSCs with different numbers of events (legend in C). Data from EPSCs with ≥8 events are combined into a single plot (blue dashed line). The interevent interval histogram for all events in the record is shown in filled gray. It is essentially the same as the 2-event histogram. Inset: interevent histogram on a logarithmic ordinate, with a best-fitting sum of 2 exponentials (time constants 0.13 and 0.74 ms, magenta). C: like B, except plots of the charge injected vs. time after the first event in the EPSC, for EPSCs with various numbers of events, normalized to display average charge per EPSC. First-event charges again are not shown. All data from experiment T. ev, Event.

