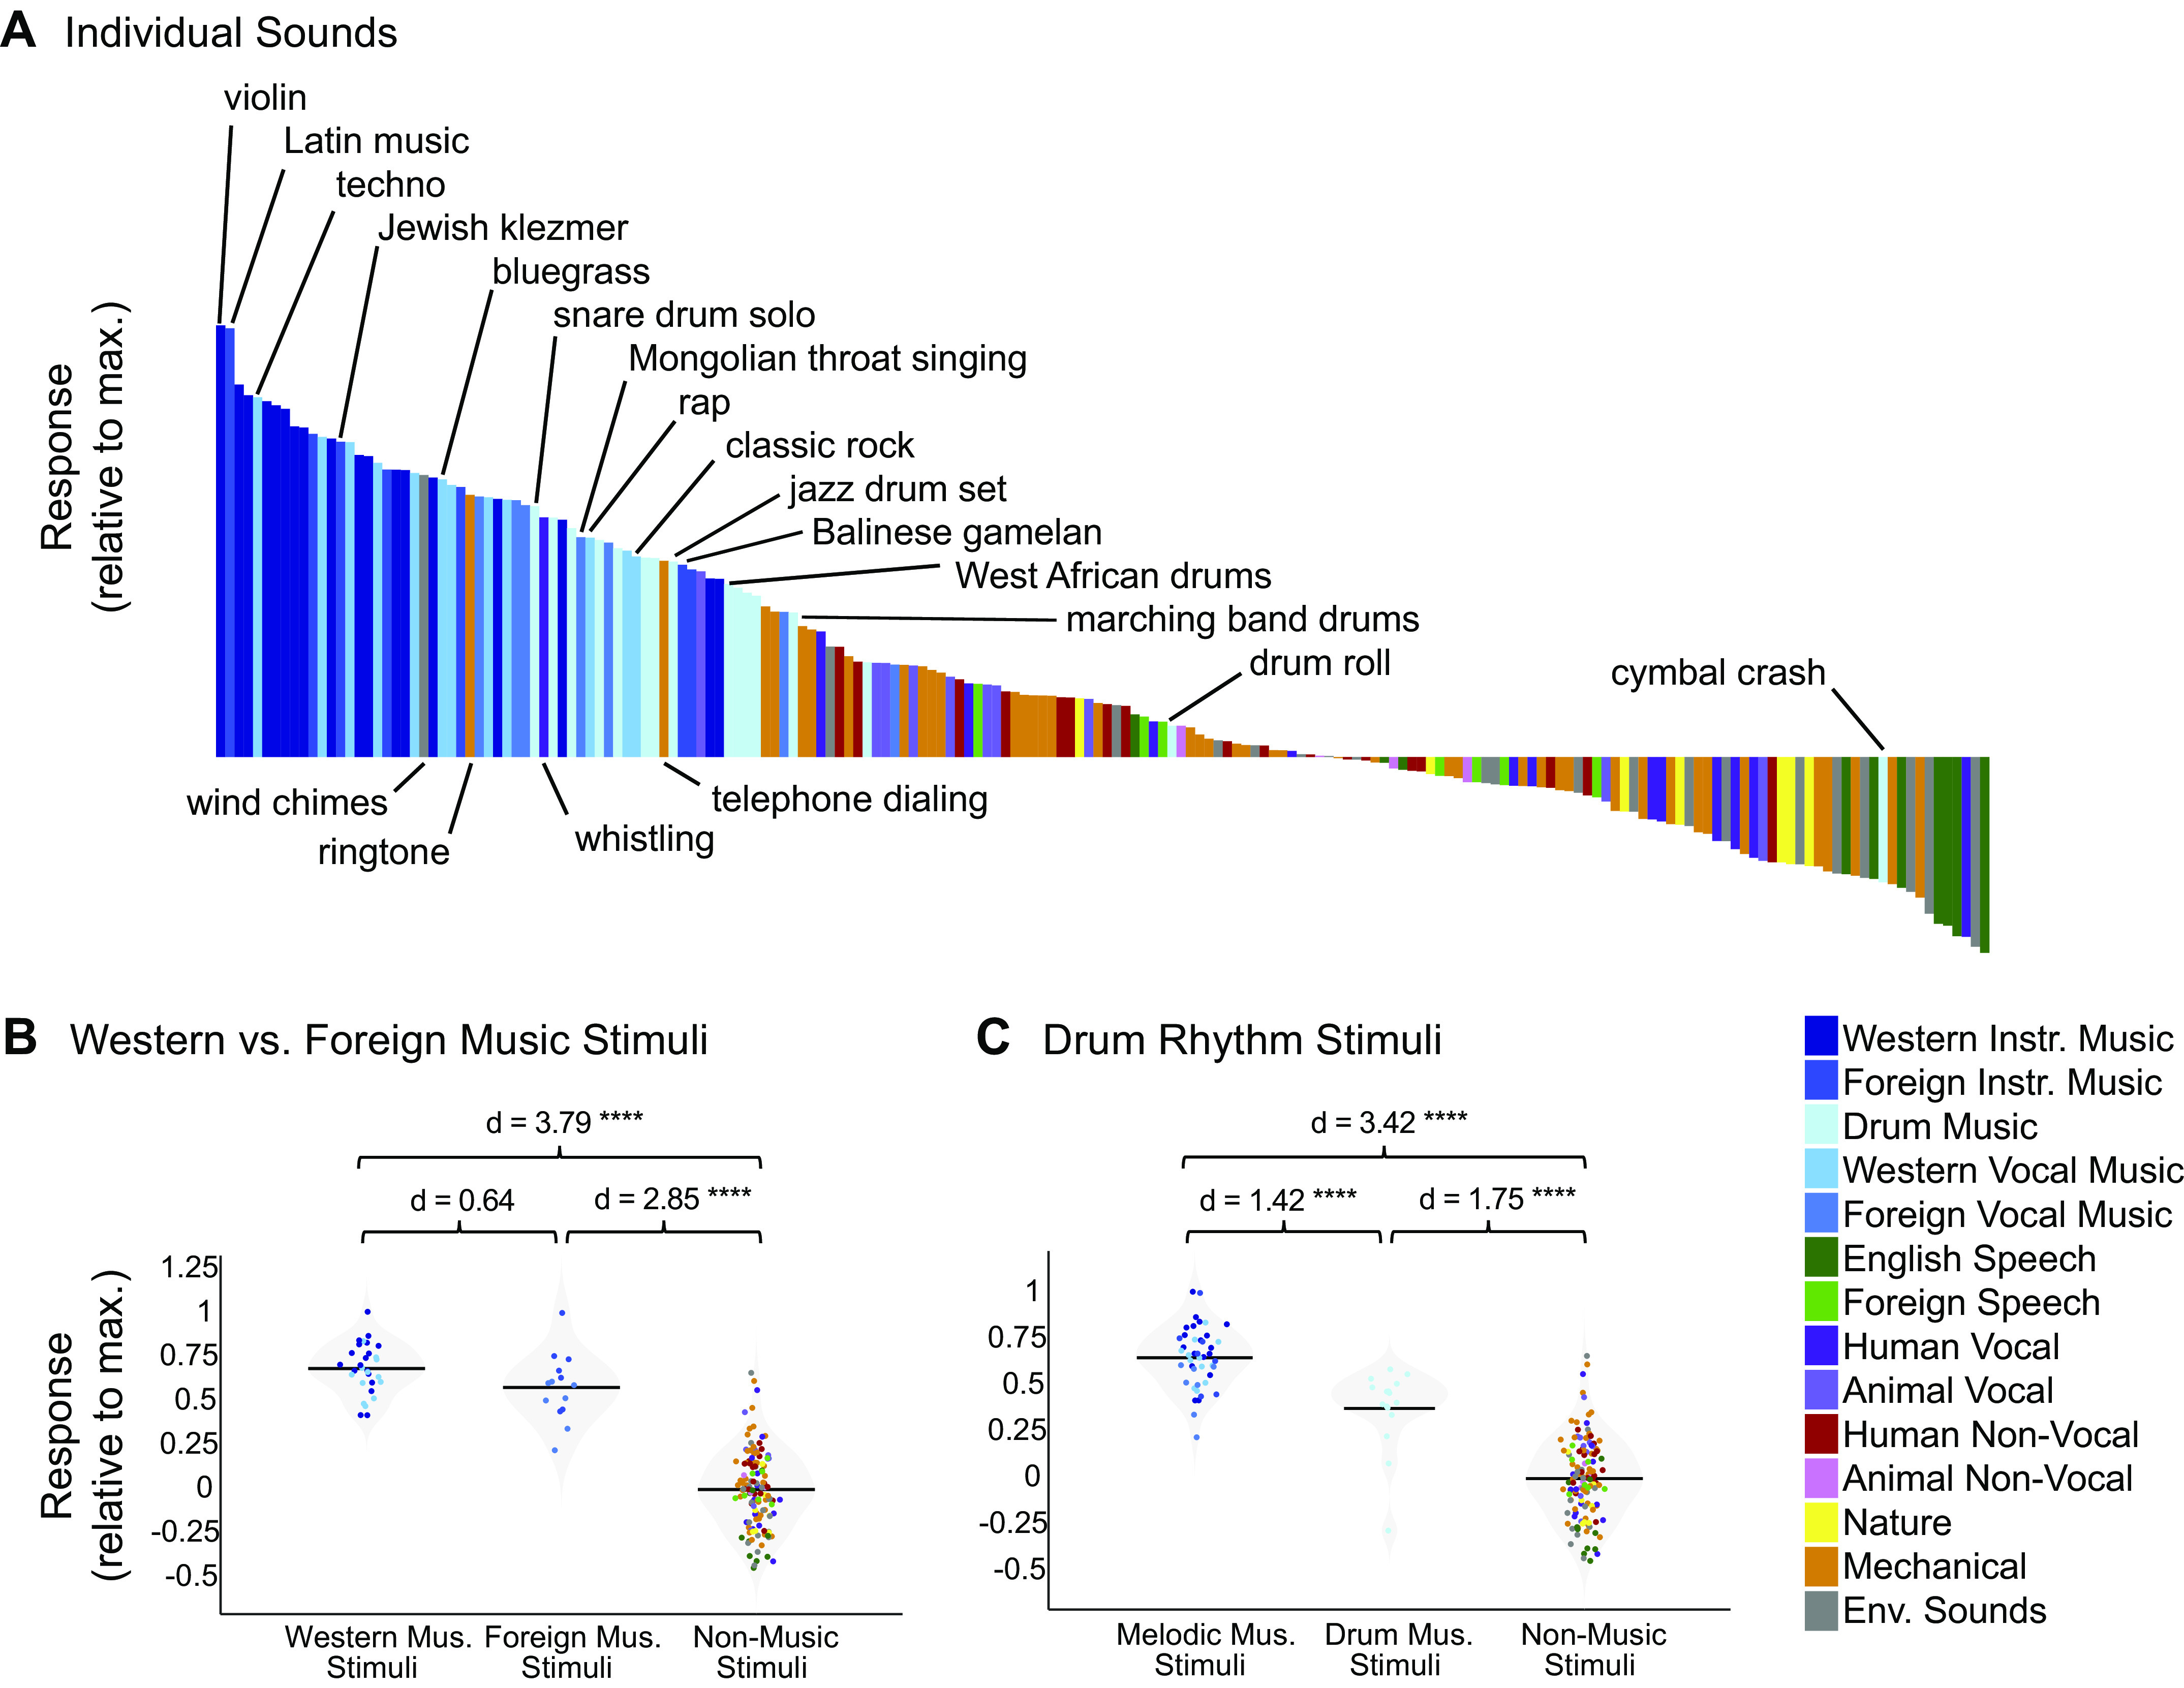
Figure 6.

A: close-up of the response profile (192 sounds) for the music component inferred from all participants (n = 20), with example stimuli labeled. Note that there are a few “nonmusic” stimuli (categorized as such by Amazon Mechanical Turk raters) with high component rankings, but that these are all arguably musical in nature (e.g., wind chimes, ringtone). Conversely, “music” stimuli with low component rankings (e.g., “drumroll” and “cymbal crash”) do not contain salient melody or rhythm, despite being classified as “music” by human listeners. B: distributions of Western music stimuli (n = 30), non-Western music stimuli (n = 14), and nonmusic stimuli (n = 132) within the music component response profile inferred from all 20 participants, with the mean for each stimulus group indicated by the horizontal black line. The separability between categories of stimuli (as measured using Cohen’s d) is shown above the plot. Note that drum stimuli were left out of this analysis. C: distributions of melodic music stimuli (n = 44), drum rhythm stimuli (n = 16), and nonmusic stimuli (n = 132) within the music component response profile inferred from all 20 participants, with the mean for each stimulus group indicated by the horizontal black line. The separability between categories of stimuli (as measured using Cohen’s d) is shown above the plot, and significance was evaluated using a nonparametric test permuting stimulus labels 10,000 times. ****Significant at P < 0.0001, two-tailed. Sounds are colored according to their semantic category.
