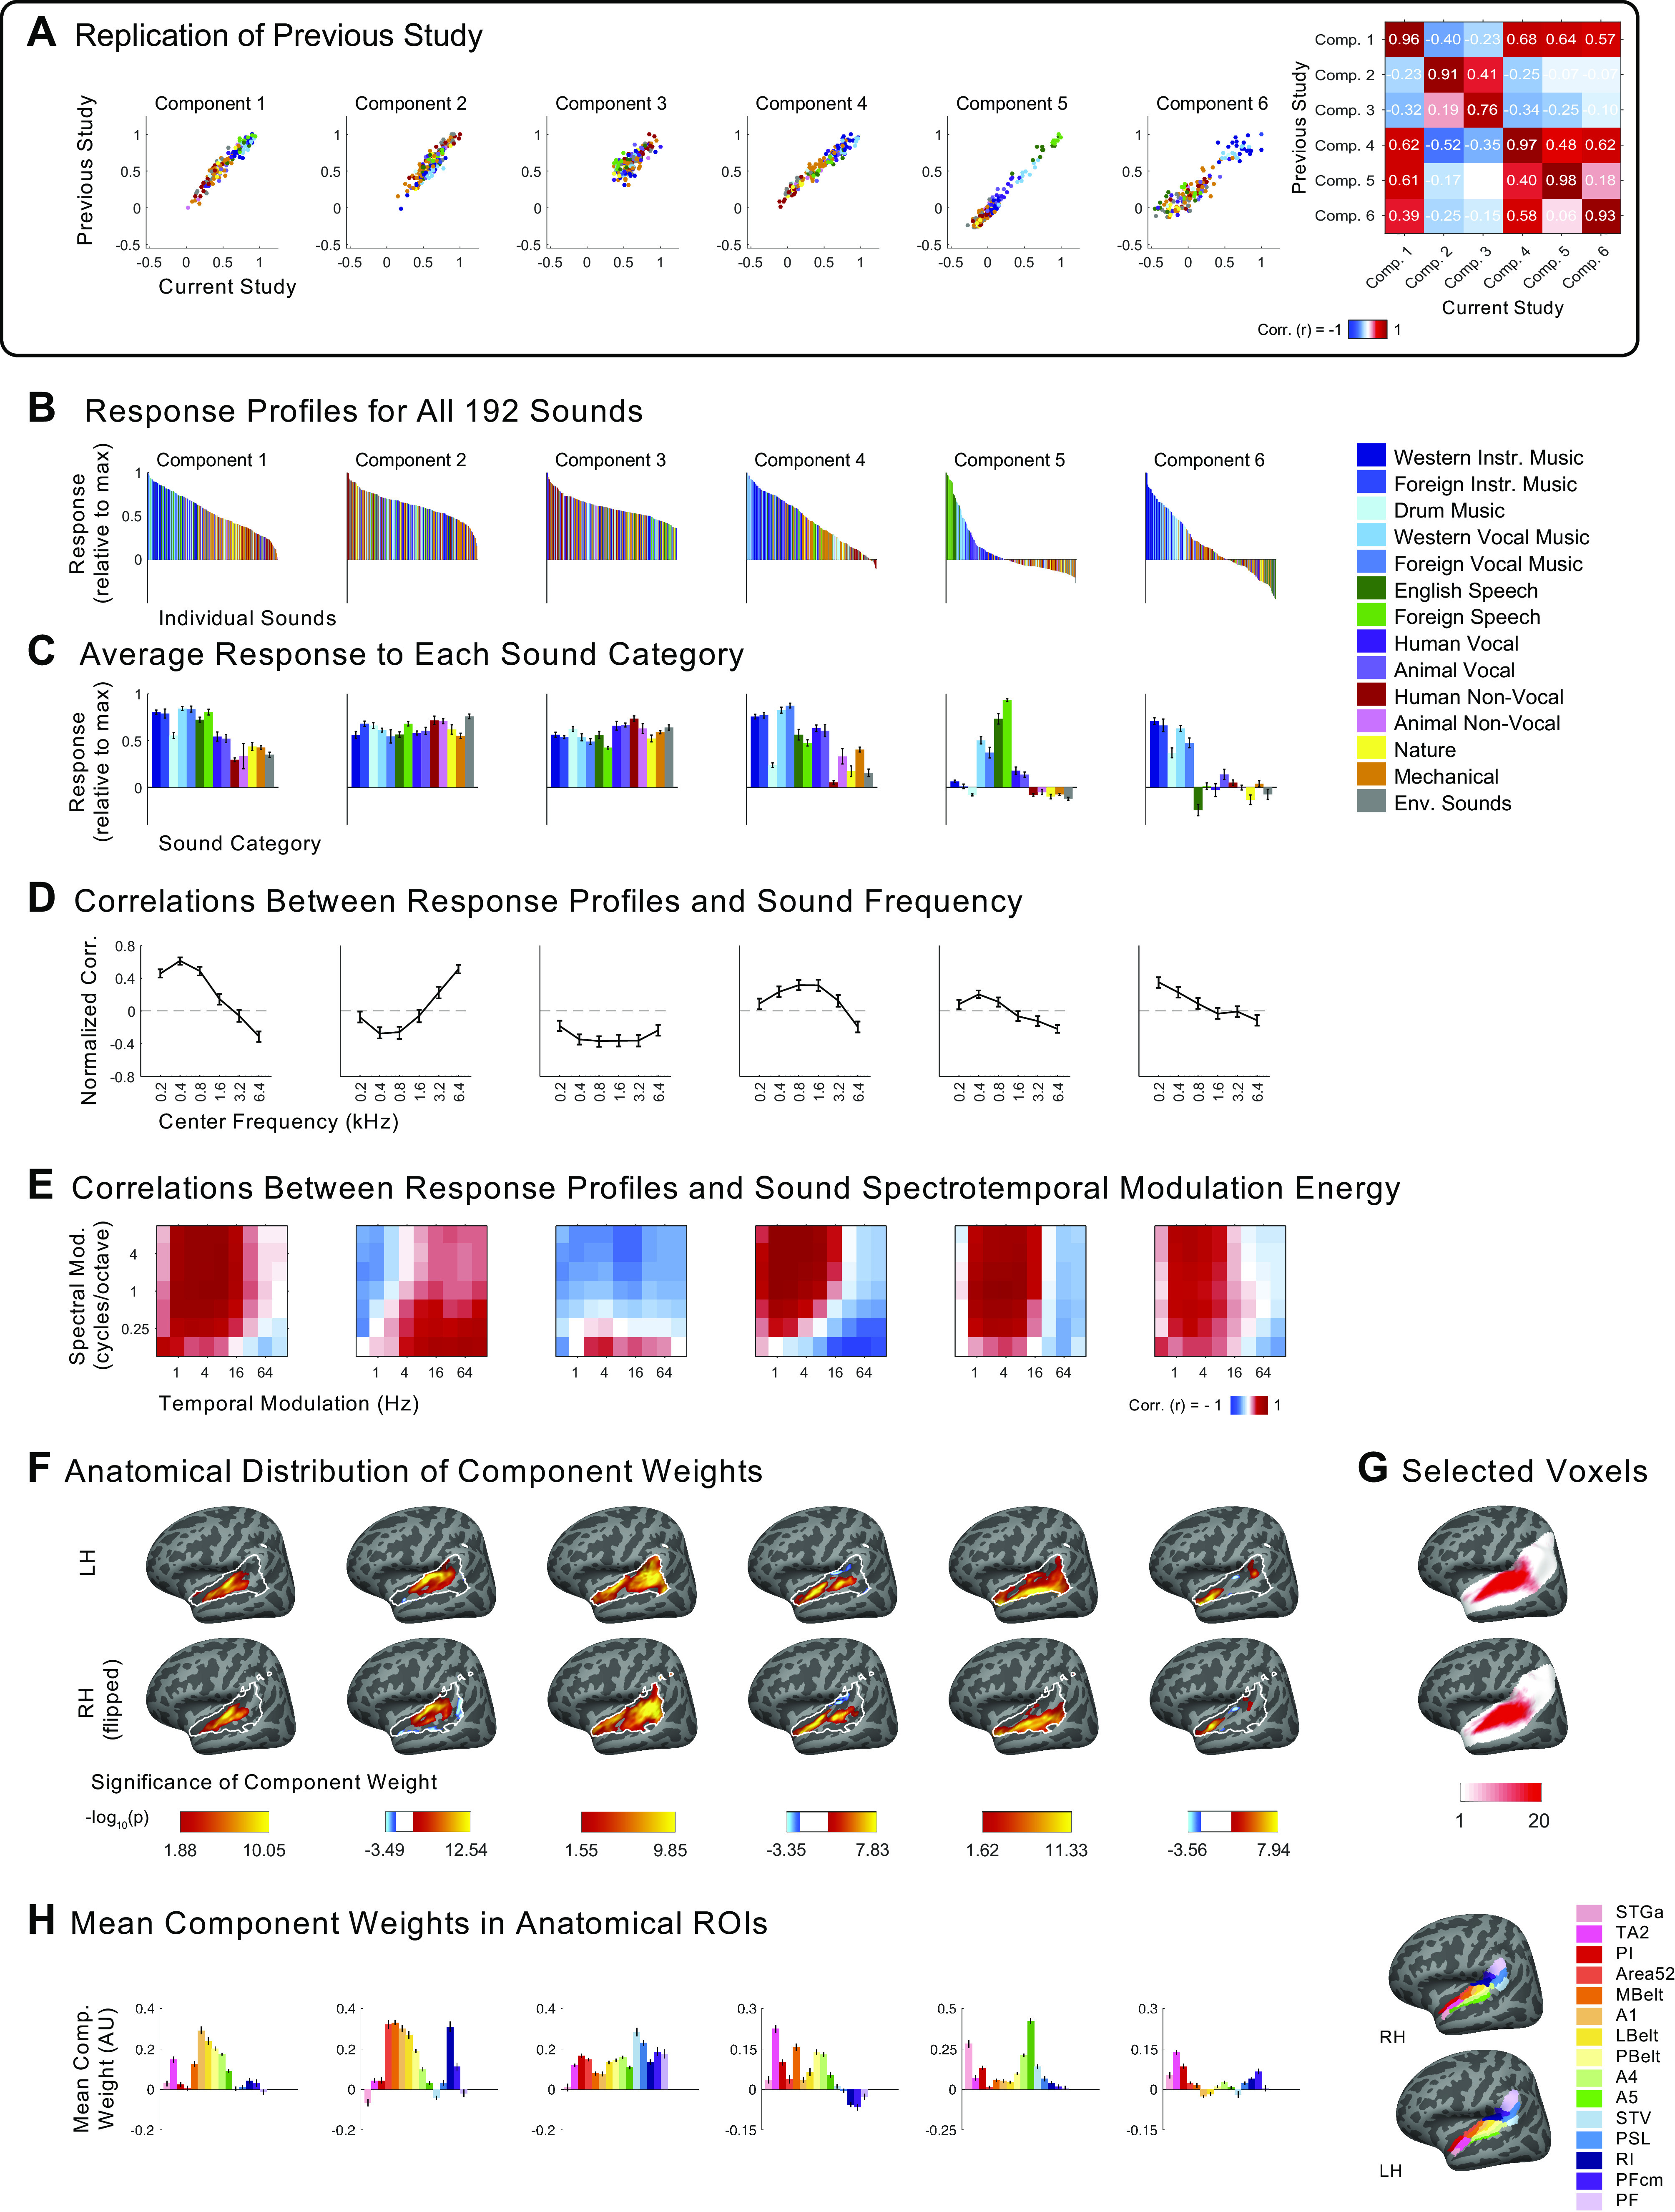
Figure A7.

Independent components inferred from voxel decomposition of auditory cortex of all 20 participants (as compared with the components in Figs. 2–5, which were inferred from musicians and nonmusicians separately). Additional plots are included here to show the extent of the replication of the results of Ref. 7. A: scatterplots showing the correspondence between the components from our previous study (n = 10; y-axis) and those from the current study (n = 20; x-axis). Only the 165 sounds that were common between the two studies are plotted. Sounds are colored according to their semantic category, as determined by raters on Amazon Mechanical Turk. B: response profiles of components inferred from all participants (n = 20), showing the full distribution of all 192 sounds. Sounds are colored according to their category. Note that “Western Vocal Music” stimuli were sung in English. C: the same response profiles as above, but showing the average response to each sound category. Error bars plot one standard error of the mean across sounds from a category, computed using bootstrapping (10,000 samples). D: correlation of component response profiles with stimulus energy in different frequency bands. E: correlation of component response profiles with spectrotemporal modulation energy in the cochleograms for each sound. F: spatial distribution of component voxel weights, computed using a random effects analysis of participants’ individual component weights. Weights are compared against 0; P values are logarithmically transformed (−log10[P]). The white outline indicates the 2,249 voxels that were both sound-responsive (sound vs. silence, P < 0.001 uncorrected) and split-half reliable (r > 0.3) at the group level. The color scale represents voxels that are significant at FDR q = 0.05, with this threshold being computed for each component separately. Voxels that do not survive FDR correction are not colored, and these values appear as white on the color bar. The right hemisphere (bottom row) is flipped to make it easier to visually compare weight distributions across hemispheres. G: subject overlap maps showing which voxels were selected in individual subjects to serve as input to the voxel decomposition algorithm (same as Fig. A2A). To be selected, a voxel must display a significant (P < 0.001, uncorrected) response to sound (pooling over all sounds compared to silence) and produce a reliable response pattern to the stimuli across scanning sessions (see equations in materials and methods section). The white area shows the anatomical constraint regions from which voxels were selected. H: mean component voxel weights within standardized anatomical parcels from Ref. 84, chosen to fully encompass the superior temporal plane and superior temporal gyrus (STG). Error bars plot one standard error of the mean across participants. LH, left hemisphere; RH, right hemisphere; ROI, region of interest.
