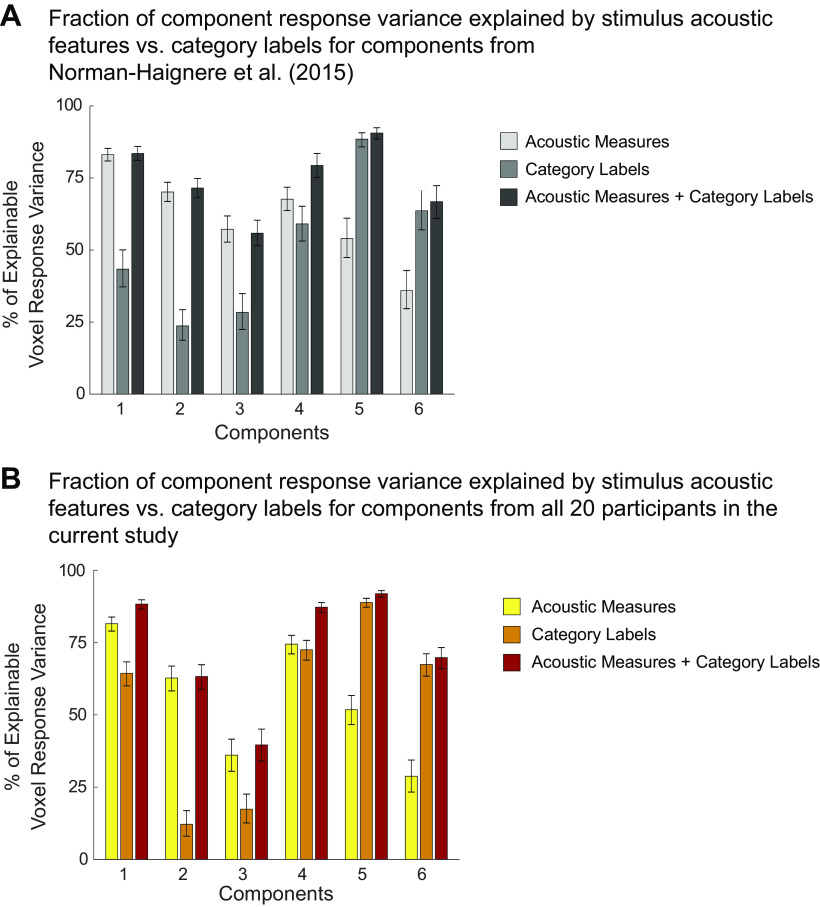
Figure A8.
Total amount of component response variation explained by 1) all acoustic measures (frequency content and spectrotemporal modulation energy), 2) all category labels (as assigned by Amazon Mechanical Turk workers), and 3) the combination of acoustic measures and category labels. A: results for components from our previous study (n = 10; 7). For components 1–4, category labels explained little additional variance beyond that explained by acoustic features. For components 5 (speech-selective) and 6 (music-selective), category labels explained most of the response variance, and acoustic features accounted for little additional variance. B: same as A but for the components inferred from all 20 participants in the current study.

