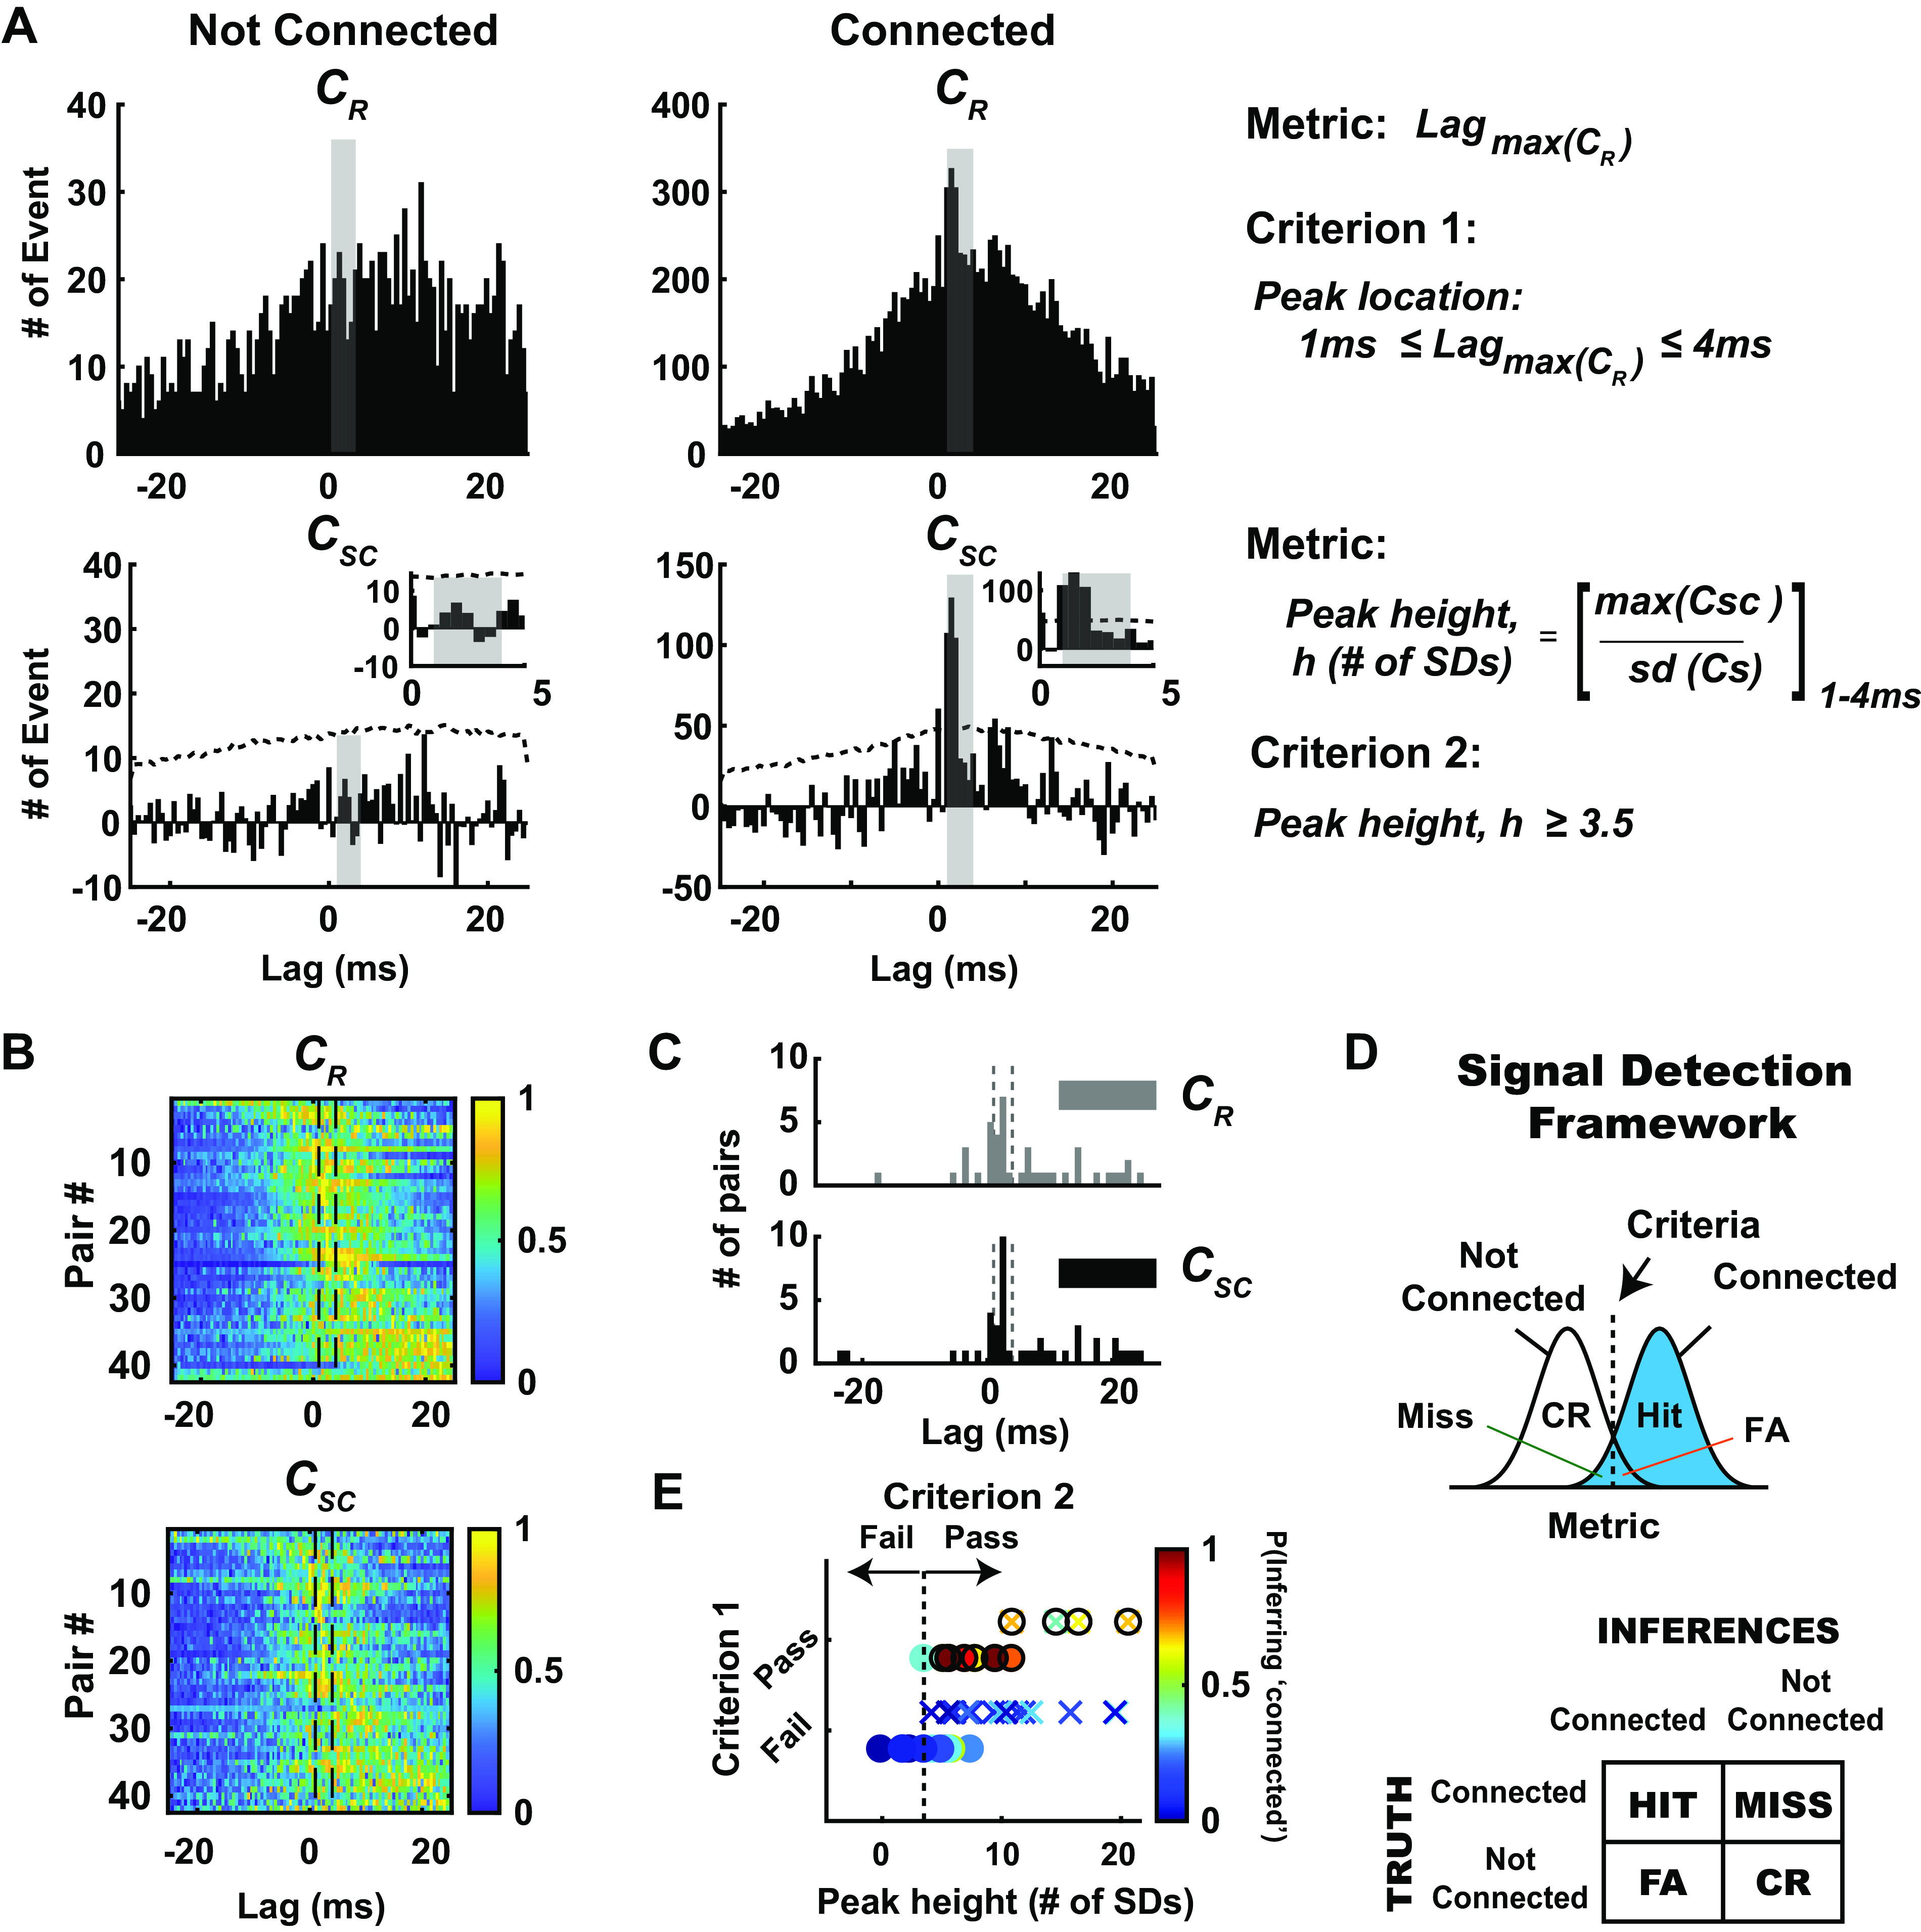
Figure 4.

Evaluation of monosynaptic connection inference in the context of a signal detection framework. A: in the context of signal detection framework, we defined 2 distinct metrics and criteria to classify neuronal pairs into connected and not-connected distribution. Shown here are representative example pairs from each condition. Top: note the qualitative difference in raw cross correlograms (CR), one with broad and distributed spikes in cross correlogram (left) and another with sharp peaks (right) in 1–4 ms time lags (shaded gray). The first metric is the maximum peak of the raw cross correlogram (CR), and criterion 1 was fulfilled if the maximum peak of the raw cross correlograms was within 1–4 ms lag. Bottom: after correcting for stimulus-driven correlations, we further quantified the significance of the peaks detected in raw cross correlogram. Hence, the second metric used here is the peak height within the window of interest (1–4 ms bin), measured as maximum peak value in shuffled-corrected cross correlogram (CSC), normalized to the number of standard deviations (SDs) with respect to the shuffled distribution. Criterion 2 was fulfilled if the peak exceeded 3.5 SDs of the shuffled distribution. B: as expected, the majority of simultaneously recorded thalamocortical pairs exhibited peak correlation after 0 time lag (n = 42 pairs; rats: 22, mice: 20). Histograms show the number of events in each bin of raw cross correlograms (top) and shuffled-corrected cross correlograms (bottom), sorted by latency of maximum peak in the cross correlograms. Data were normalized to maximum peak, and the colors in each row show the number of events for an individual pair, normalized to maximum peak. C: distribution of the lags of the peak location in the raw and shuffled-corrected correlograms across all recorded pairs. Note that the peak locations for raw and shuffled-corrected correlograms were largely the same, shifted only by 1–2 bin size (0.5-ms bin). D: within this framework, 4 possible outcomes are possible: hit: connected and inferred to be connected; miss: connected but inferred to be not connected; false alarm (FA): not connected but inferred to be connected; correct rejection (CR): not connected and inferred to be not connected. E: in this context, we found that 11/42 pairs have putative monosynaptic connection (denoted by filled circles) and 31/42 pairs. Pairs were not connected (n = 22 pairs, N = 12 rats; n = 20 pairs, N = 1 mouse). Note that criterion 1 was a binary classification: pairs having peak locations from their raw cross correlograms within the 1–4 ms lag pass criterion 1, and those that do not fail criterion 1. For criterion 2, the dashed vertical line represents 3.5 SDs for the peak height metric: pairs having peak height above this criterion line pass criterion 2. Only pairs that passed both criteria 1 and 2 were classified as connected [anything to the right of the vertical dashed line in E (top row)], and the rest were classified as not connected. For each recorded pair, probability of inferring monosynaptic connection (i.e., probability of bootstrapped data satisfying criteria 1 and 2) is depicted with a color bar. Note that 1,000 iterations were performed for each data set.
