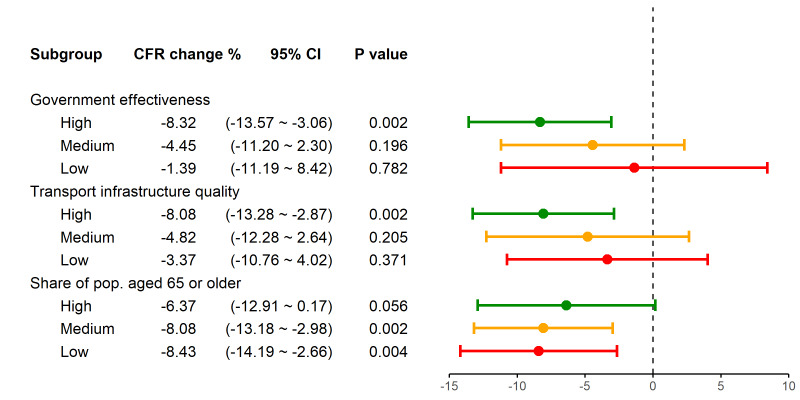
Figure 3.
Results of subgroup analyses, by level of government effectiveness, transport infrastructure quality, and share of population aged 65 or older. For each country characteristic, countries were ranked and divided into three groups: high (green), medium (yellow), and low (red), with an equal size. The second column displays the percentage change in case fatality ratio (CFR) associated with a 10% increase in vaccine coverage, which was illustrated as the solid circle in the figure. All three regressions were conducted by using the full sample, 2200 country-week observations.

