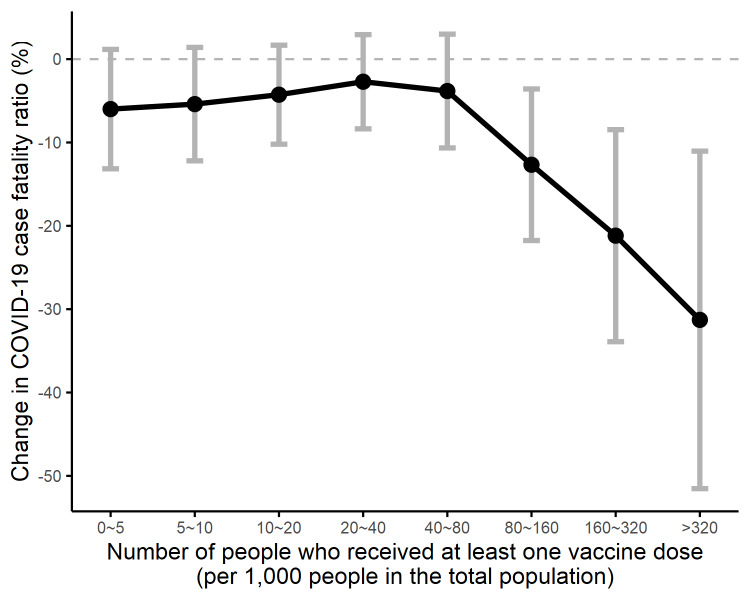
Figure 4.
Dynamic associations between vaccine coverage and the case fatality ratio. This figure shows the percentage change in case fatality ratio (CFR) associated with different intervals of vaccine coverage. Values of CFR change on the y-axis were the estimated coefficients of binary indicator for interval of vaccine coverage provided in Table 3. According to Table 3, the reduced CFR was statistically significant when the vaccine coverage per 1000 people fell in the interval of 80-160, 160-320, and ≥320.

