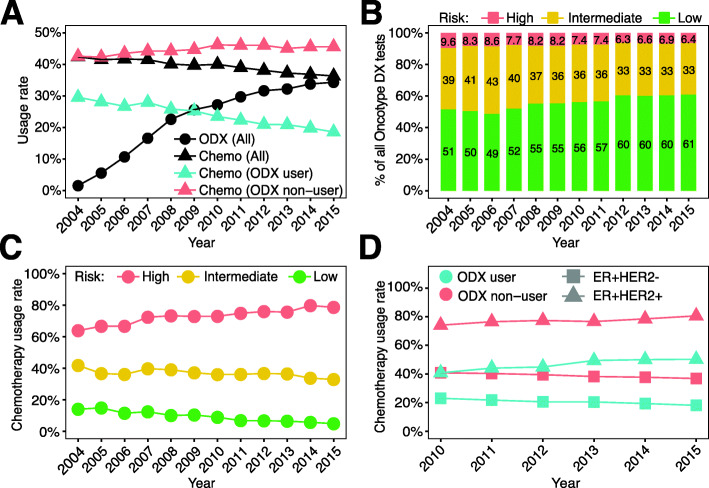
Fig. 2.
Usage of chemotherapy in Oncotype DX users between 2004 and 2015. A Oncotype DX usage rates among patients undergoing chemotherapy (triangles) and overall Oncotype DX usage rate (circles). B Percentage of risk groups (high-, intermediate-, and low-risk) classified by Oncotype DX test results. C Percentage of chemotherapy usage between high-, intermediate-, and low-risk Oncotype DX groups. D Chemotherapy usage among patients with ER+HER2− and ER+HER2+ breast cancer, stratified by Oncotype DX usage. For A, C, and D, usage rates were calculated based on the total number of patients within each indicated patient subgroup

