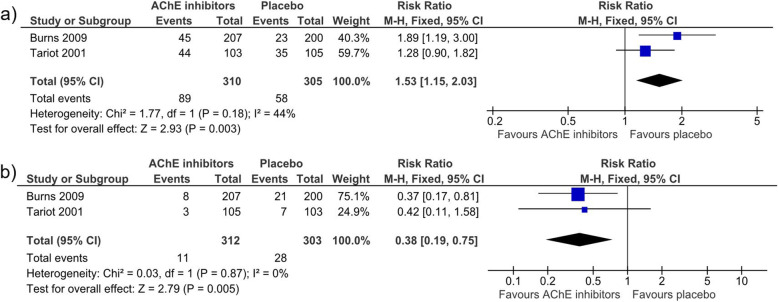
Fig. 3.
Forest plots of AChEI neurological AEs and deaths by Tariot et al. [58] and Burns et al. [57]. a Forest plot of the pooled neurological adverse events in Burns et al. and Tariot et al. b Forest plot of the pooled number of deaths in Burns et al. and Tariot et al. 95% CI = 95% confidence interval; AChE-I = acetylcholinesterase inhibitor; Chi2 = Chi2 test value to evaluate heterogeneity; df = degrees of freedom; fixed = fixed effects model; I2 = I2 test value to evaluate heterogeneity; IV = inverse variance; MD = mean difference; M-H = relative risk by Mantel-Haenszel; Neurolog. AEs = neurological adverse events; SD = standard deviation

