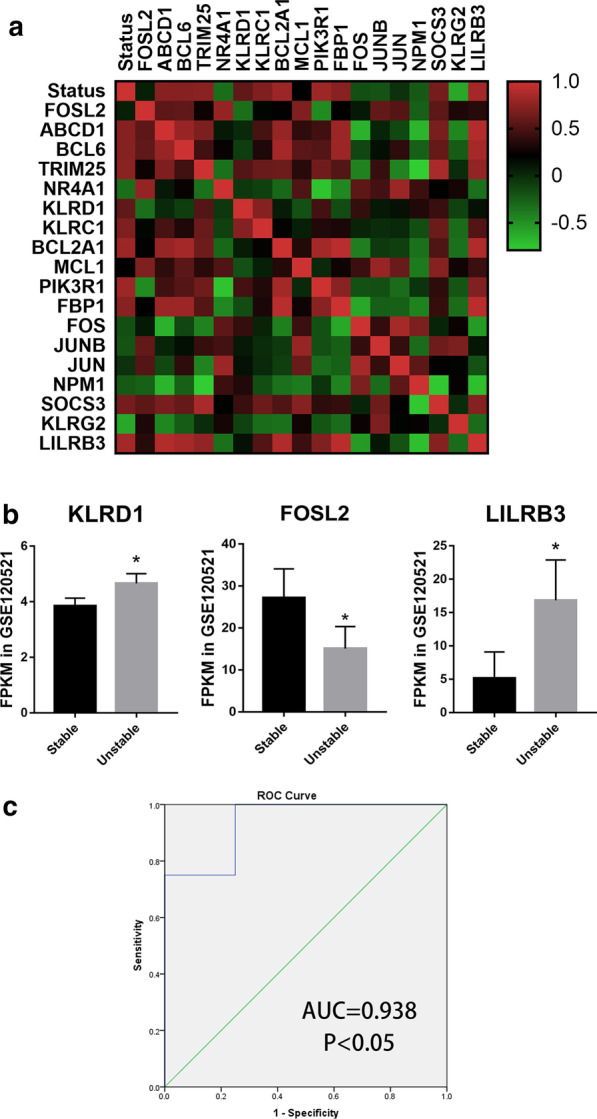
Fig. 4.

Validation of the screened genes. a The correlationship among the plaques status and the screened seed genes in human plaques in unstable region compared to stable region. b The three screened genes FPMK value of RNA sequencing in GSE120521. *P < 0.05. c The ROC curve analysis of the three‐gene signature (KLRD1 + FOSL2 + LILRB3) for the discrimination of stable and unstable plaques in GSE120521 dataset. AUC indicates area and P‐value is shown under the ROC curve, respectively. AUC, area under the curve; ROC, receiver operating characteristic
