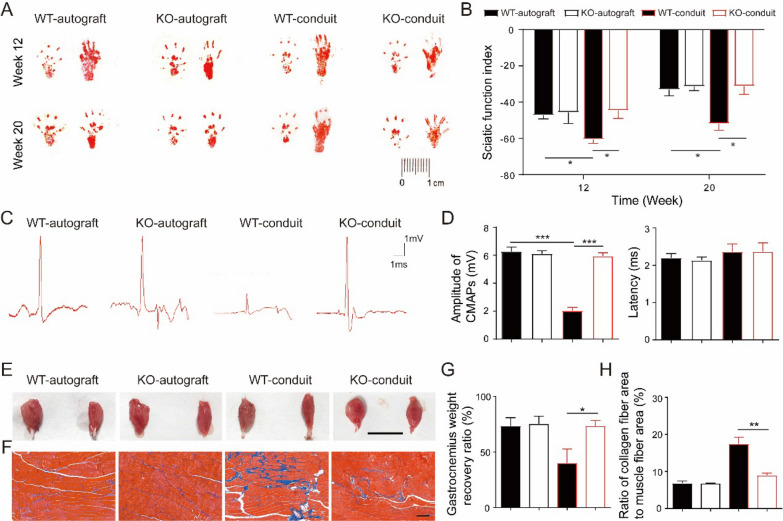
Fig. 2.
KO mice had improved functional recovery of sciatic nerve comparing to WT mice. a Representative image of walking track. b SFI analysis. N = 10. c Representative CMAPs recorded on the regenerated nerve. d Analysis of peak amplitude and latency of CMAPs. N = 3. e Images of gastrocnemius muscle from both normal (left) and operative (right) sides. Bar = 1 cm. f Masson’s trichrome staining of gastrocnemius muscle sections. Bar = 100 μm. g The gastrocnemius weight recovery ratio. N = 10. h The ratio of collagen fiber area to muscle fiber area. N = 3. All values are expressed as Mean ± SD. *P < 0.05; **P < 0.01; ***P < 0.001

