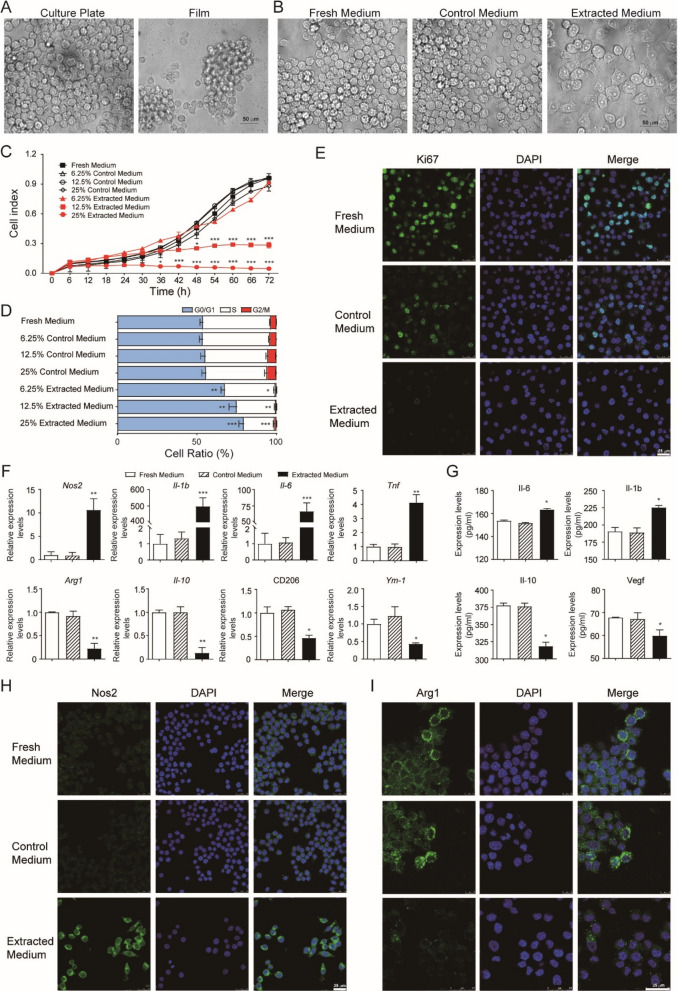
Fig. 5.
Chitosan conduits affected the growth and polarization of Raw264.7 macrophage cells. a Light microscope images of cells cultured on the plate and chitosan film. b Light microscope images of cells cultured in 25% different media for 24 h. c RTCA analysis of cells cultured in different media. N = 3. d Cell cycle analysis by flow cytometry of cells cultured in different media for 24 h. N = 3. e Immunofluorescence images of cells cultured in 25% different media for 24 h. f Quantitative PCR analysis of cells cultured in 25% different media for 24 h. N = 5. g ELISA analysis of the supernatants from cells cultured in 25% different media for 24 h. N = 3. h, i Immunofluorescence images of cells cultured in 25% different media for 24 h. All values are expressed as Mean ± SD. *P < 0.05; **P < 0.01; ***P < 0.001; comparing to control medium with the same concentration

