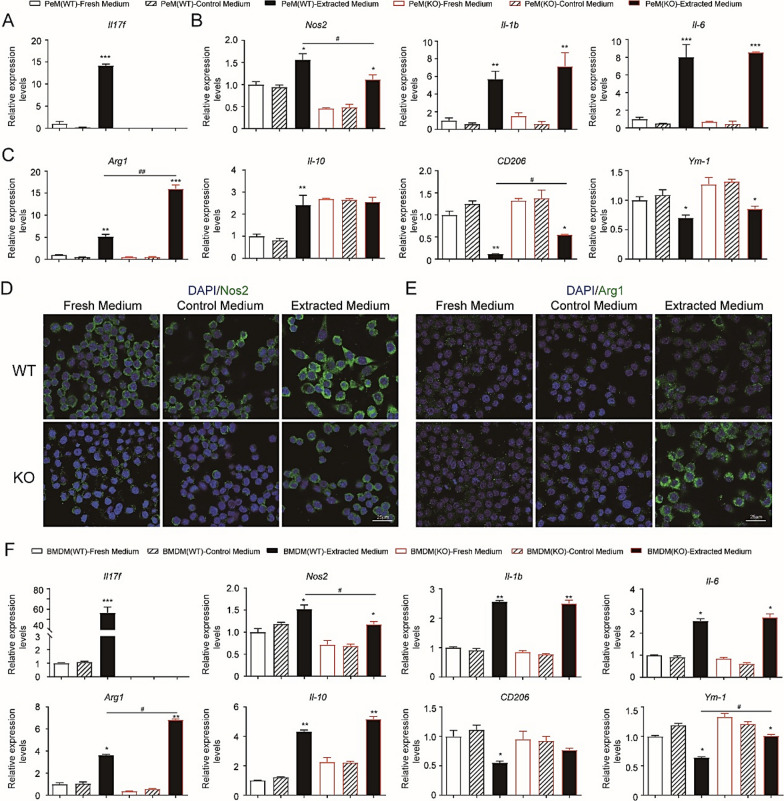
Fig. 6.
Peritoneal macrophages (PeM) and Bone marrow derived macrophages (BMDM) from KO and WT mice polarized differently after chitosan conduits extracts treatment. a, c Quantitative PCR analysis of PeM cells treated with 25% different media for 24 h. N = 5. d, e Immunofluorescence images of cells treated with 25% different media for 24 h. f Quantitative PCR analysis of BMDM cells treated with 25% different media for 24 h. N = 3. All values are expressed as Mean ± SD. *P < 0.05; **P < 0.01; ***P < 0.001; comparing to control medium. #P < 0.05; ##P < 0.01

