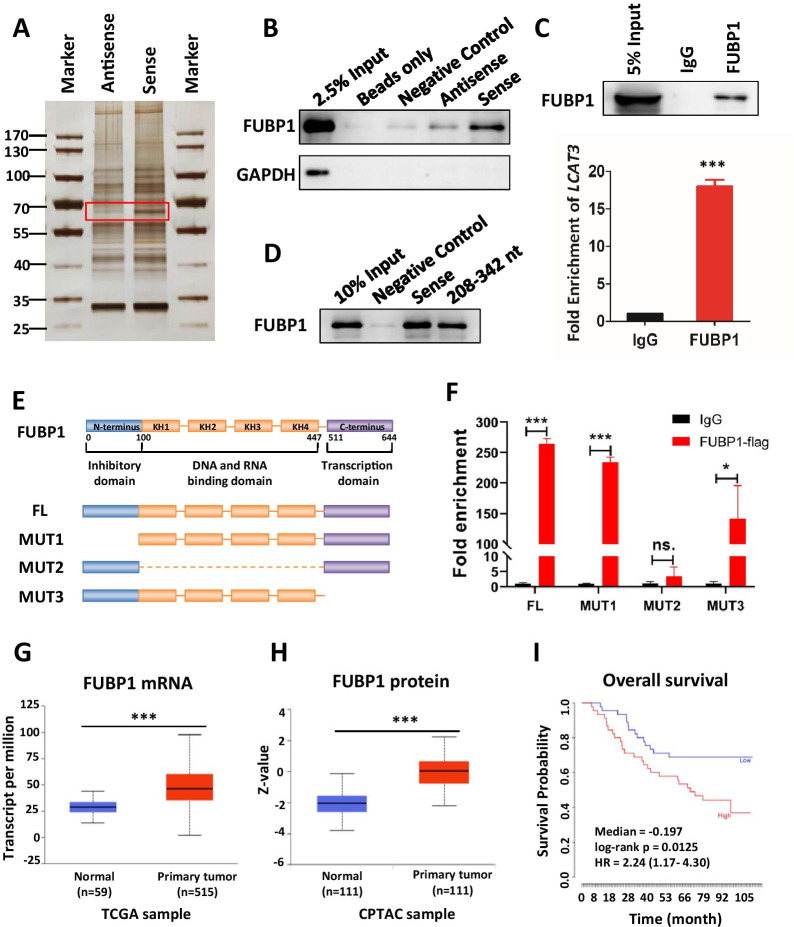
Fig. 5.
LCAT3 physically interacts with FUBP1. A Proteins interacting with LCAT3 were identified by pull down assay followed by mass spectrometry analysis. B Western blot analysis of FUBP1 in beads only, negative control, sense and antisense LCAT3 pull-down fractions. GAPDH served as a negative control. C. FUBP1 RIP assays in Calu1 cells. A western blot assay confirmed FUBP1 immunoprecipitation (Up); The relative fold enrichment of LCAT3 between FUBP1 and IgG RIP fractions was determined by qRT-PCR (Down). D LCAT3 sense and 208–342 nt fragments were performed with RNA pull down and western blotting assays. E The schematic structure of full-length FUBP1 proteins (FL: 1–644) and three domain-deleted mutants (MUT1: 100–644; MUT2: 1–100 and 447–644; MUT3: 1–511) of FUBP1 variants used in this study. The blue box is the inhibitory domain, the orange box is the DNA and RNA binding domain, and the purple box is the transcription domain. F RIP assays were performed using anti-FLAG antibodies in Calu1 cells that were transfected with vectors expressing the FLAG-tagged FL and the deleted mutants (MUT1-3) of FUBP1. G Relative mRNA expression of FUBP1 primary tumors (n = 515) and in adjacent normal tissues (n = 59) from TCGA LUAD samples. H Relative protein expression of FUBP1 in primary tumors (n = 111) and adjacent normal tissue (n = 111) from Clinical Proteomic Tumor Analysis Consortium (CPTAC) LUAD samples. I Kaplan–Meier survival analysis of overall survival of lung cancer patients using FUBP1 expression. The data were downloaded from the study of Takeuchi et al. (GEO accession: GSE11969; No. patients: 90)

