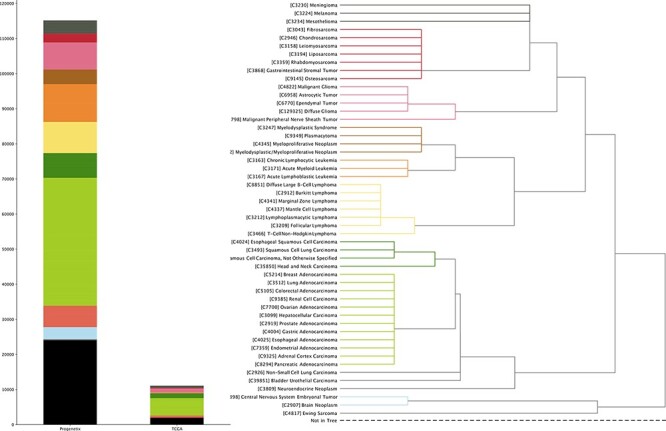
Figure 2.

The genomic CNV fraction across 51 NCIt umbrella nodes Each dot represents one sample’s CNV fraction range from 0 to 1 and the red horizontal line indicates median CNV of the respective cancer type. Each cancer type contains between 104 and 11 804 CNV profiles (median 904; See Supplementary Table S1).
