Fig. 1.
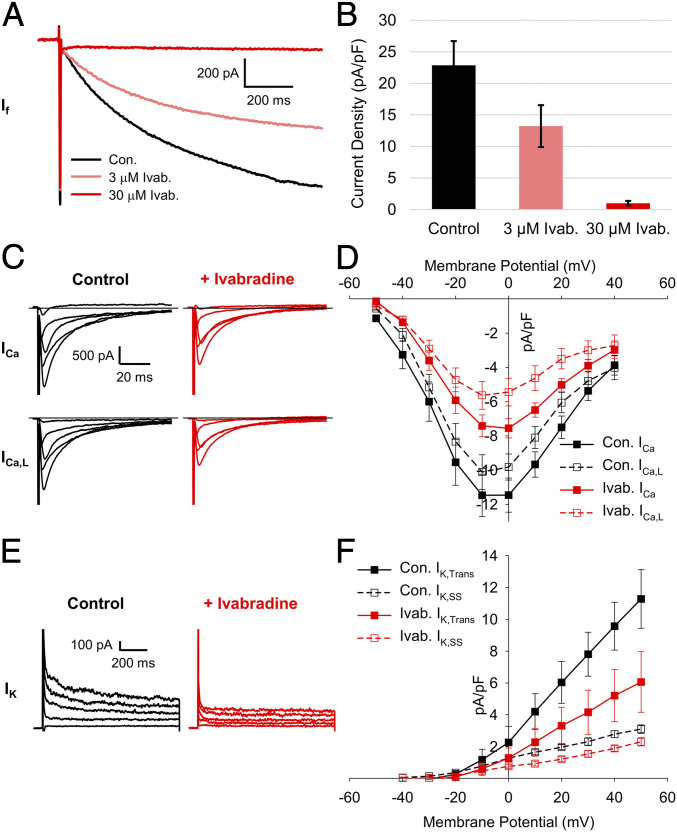
A concentration of 30 µM ivabradine blocks Ca2+ and K+ currents in SAMs. (A) Representative whole-cell currents recorded from a murine SAM in response to 1-s hyperpolarizing voltage steps to −130 mV from a holding potential of −60 mV in a control Tyrode’s solution with 1 mM BaCl2 (black) and after perfusion of Tyrode’s containing 3 µM (pink) or 30 µM (red) ivabradine. (B) Average (± SEM) current density of If in 1 mM BaCl2 (black) and after perfusion of 3 µM (pink) or 30 µM (red) ivabradine during pulses to −130 mV in murine SAMs. (C) Representative total (Top) and L-type (Bottom) whole-cell Ca2+ currents recorded from sinoatrial myocytes in control (black) and after perfusion of 30 µM ivabradine (red). (D) Mean (± SEM) total (closed) and L-type (open) Ca2+-current density in control and after perfusion of 30 µM ivabradine using the same color scheme as C. (E) Representative whole-cell K+ currents in a SAMs in control conditions (black) and after perfusion of 30 µM ivabradine (red). (F) Average (± SEM) transient (closed) and steady-state (open) K+-current density in control conditions and after perfusion of 30 µM ivabradine using the same color scheme as E. Horizontal lines indicate zero current. Number of replicates and details of statistical tests can be found in SI Appendix, Table S1.

