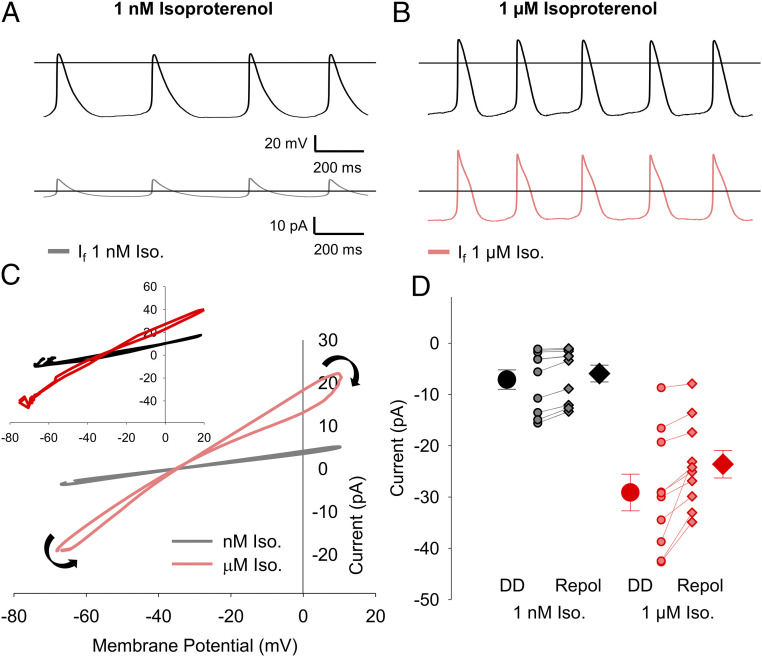
Fig. 7.
Simulations of If produce a biphasic current with limited voltage-dependent gating in response to sinoatrial APs. (A) Simulated If generated by a model fit to data from 1 nM isoproterenol (gray) in response to APs recorded in 1 nM isoproterenol (Top). (B) Simulated If generated by a model fit to data from 1 μM isoproterenol (pink) in response to APs recorded in 1 µM isoproterenol (Top). Horizontal lines indicate zero voltage or zero current levels. (C) Representative current–voltage relationships of If simulated by the 1 nM model (gray) or the 1 μM model (pink) in response to sinoatrial APs recorded from single cells in the same condition. Black arrows indicate the progression of the current–voltage relationship over time. (C, Inset) Average current–voltage relationships of If simulated by the 1 nM model (black) or the 1 μM model (red) in response to the full sets of sinoatrial APs recorded in 1 nM or 1 μM isoproterenol. (D) Average (± SEM) simulated If current amplitude at −60 mV during the latter diastolic depolarization (DD; circles) and AP repolarization (Repol; diamonds) in response to recorded sinoatrial APs simulated using the 1 nM isoproterenol model (black) or the 1 µM isoproterenol model (red). Individual simulations in response to different 1 nM (gray) or 1 μM (pink) APs are shown by the smaller symbols. Number of replicates can be found in SI Appendix, Table S5.

