Fig. 4.
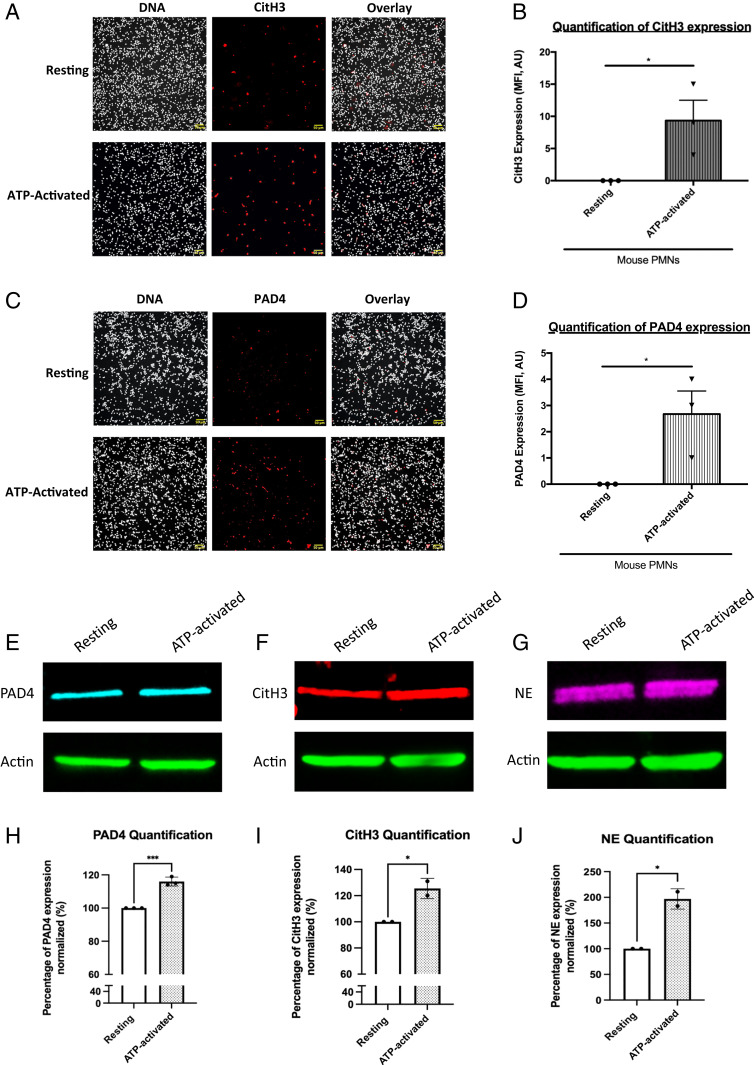
PAD4, CitH3, and NE are already express by resting and ATP-activated neutrophils. (A) Representative images of CitH3 expression on resting and ATP-activated mouse neutrophils. Purified neutrophils were activated with ATP (ATP-activated) or not (resting). Neutrophils were immunostained with anti-CitH3 antibody (in red) and Hoechst 33342 for DNA labeling (in gray). Colocalization of both labeling (DNA/CitH3+) is in pink. (B) Graph depicts the means +/− SEM of neutrophils CitH3+ quantified in each condition (Student’s t test, *P < 0.05). (C) Representative images of PAD4 expression on resting and ATP-activated neutrophils. Neutrophils were immunostained with anti-PAD4 antibody (in red) and Hoechst 33342 for DNA labeling (in gray). Colocalization of both labeling (DNA/PAD4 +) is in pink. (D) Graph depicts the means +/− SEM of neutrophils PAD4+ quantified in each condition (Student’s t test, **P < 0.01). Three independent experiments with a minimum of five fields recorded for each condition. (E–G) Western blot analysis of PAD4 (E), CitH3 (F), and NE (G) expression on resting and ATP-activated neutrophils and corresponding statistical analysis. (H–J) Graph depicts the means +/− SEM of PAD4 (H), CitH3 (I), and NE (J) protein quantified in resting and ATP-activated neutrophils (Student’s t test, *P < 0.05, ***P < 0.001).

