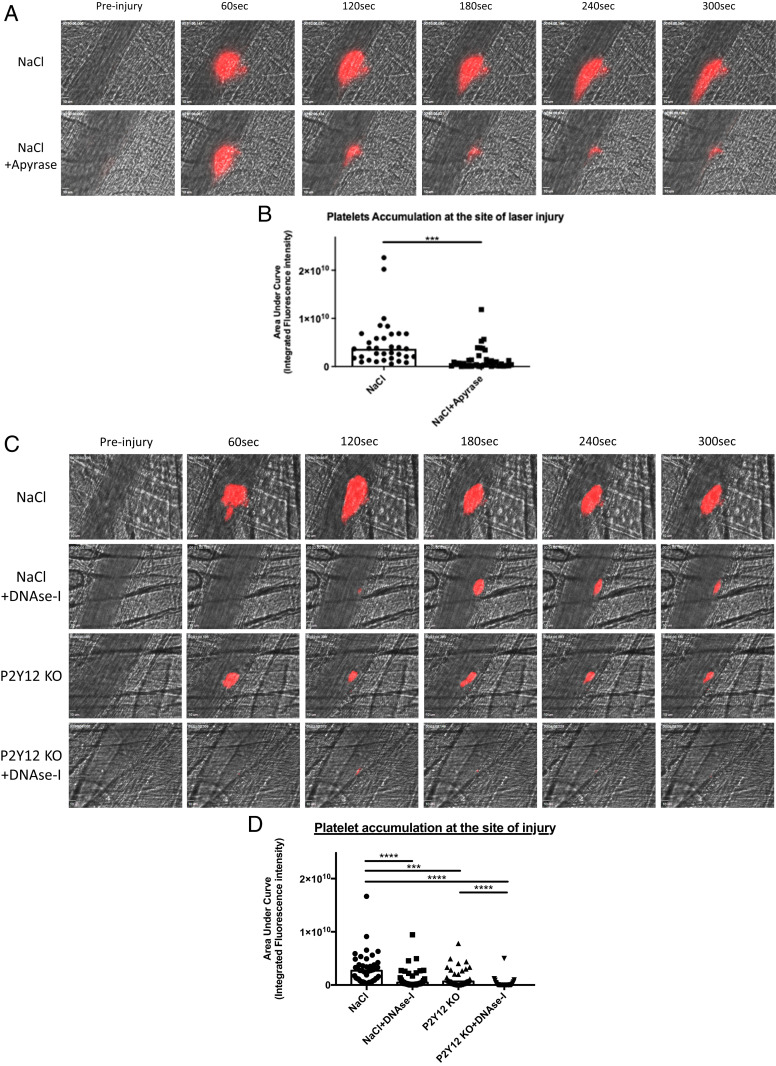
Fig. 7.
The model laser of thrombosis is both ATP and ADP dependent. (A) Representative images of thrombus formation after a laser injury overtime in control WT mice (NaCl) and mice injected in Apyrase (NaCl+Apyrase). The thrombus formation was evaluated through platelet accumulation depicted in red. Blood flow was from the Top to the Bottom. (B) Graph depicts the medians of area under curve of fluorescent signal of platelet accumulation after a laser injury in WT mice (NaCl, 45 thrombi in four mice) and mice injected in Apyrase (NaCl + Apyrase, 32 thrombi in three mice) (Mann–Whitney U test, ***P < 0.001, ****P < 0.0001). (C) Representative images of thrombus formation after a laser injury overtime in control condition WT mice (NaCl), control mice injected in DNase-I (NaCl + DNase-I), P2Y12 Knockout mice (P2Y12 KO), and P2Y12 Knockout mice injected in DNase-I (P2Y12 KO + DNase-I). The thrombus formation was evaluated through platelet accumulation depicted in red. Blood flow was from the Top to the Bottom. (D) Graph depicts the medians of area under curve of fluorescent signal of platelet accumulation after a laser injury in WT mice (NaCl, 45 thrombi in four mice), control mice injected in DNase-I (NaCl + DNase-I, 33 thrombi in three mice), P2Y12 KnockOut mice (P2Y12 KO, 38 thrombi in three mice), and P2Y12 Knockout mice injected in DNase-I (P2Y12 KO + DNase-I, 32 thrombi in three mice) (Mann–Whitney U test, ***P < 0.001, ****P < 0.0001).

