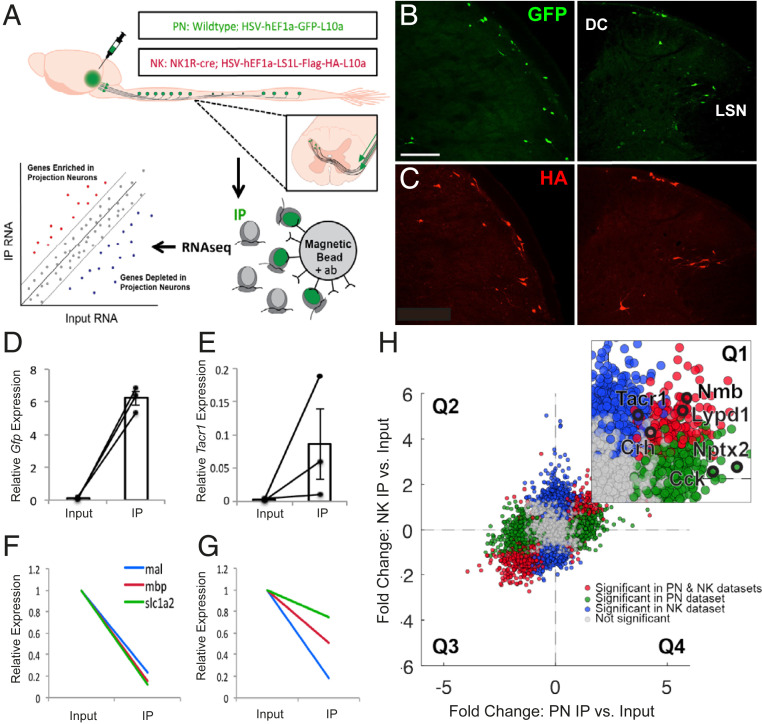
Fig. 1.
Selective purification and profiling of projection neurons reveal candidate genes expressed by projection neurons. (A) Experimental design. (B and C) Representative images of GFP (B) and HA (C) immunofluorescence in nucleus caudalis (Left) and spinal cord (Right) from wild-type and NK1R-Cre mice, respectively, illustrate projection neurons GFP or HA-tagged ribosomal protein. (Scale bar 100 μm.) (D and E) qPCR results showing enrichment of Gfp (D) and Tacr1 (E) in IP relative to input samples, in PN and NK experiments, respectively. Data are normalized to Rpl27 and represented as mean ± SEM. (F and G) qPCR shows depletion of glial genes in IP relative to input samples in PN (F) and NK (G) experiments. Data are normalized to Rpl27 and input relative expression and represented as mean ± SEM. (H) RNA sequencing shows differential expression data of IP relative to input fold change for PN experiments vs. NK experiments. Quadrant 1 (Q1) contains genes enriched in both datasets; Q2 contains genes depleted in both; Q3 and Q4 contain genes differentially altered in PN vs. NK datasets. Inset shows enlarged Q1 with genes of interest highlighted in black. Genes significantly enriched or depleted in both PN and NK datasets are highlighted in red. Genes significantly changed in PN, but not NK dataset, are highlighted in green, while genes significantly changed in NK, but not PN, datasets are highlighted in blue. All significant differences P < 0.05.

