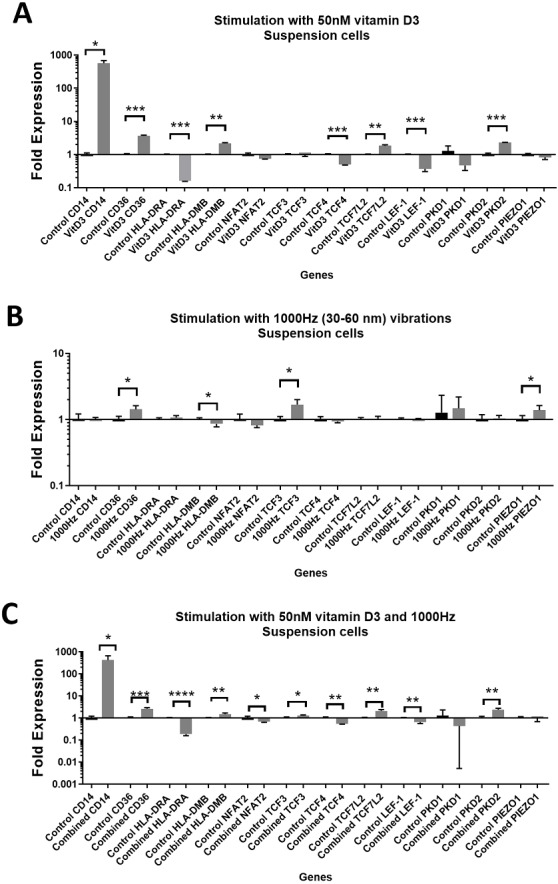
Figure 1. Gene expression in response to different stimulations in suspension THP-1 cells, compared to the unstimulated suspension THP-1 cells.

(A) mRNA regulation in response to stimulation with 50nM of 1,25-dihydroxyvitamin D3. (B) mRNA regulation in response to 1,000 Hz vibrations (amplitude 30–60 nm). (C) mRNA regulation in response to the combined vitamin D (50 nM) and 1,000 Hz (30–60 nm amplitude) vibrations. Data presented as mean of four replicates ± SEM. Statistical analysis between stimulated and control values was assessed by unpaired T test with Welch’s correction. P values lower than 0.05 were considered statistically significant.
