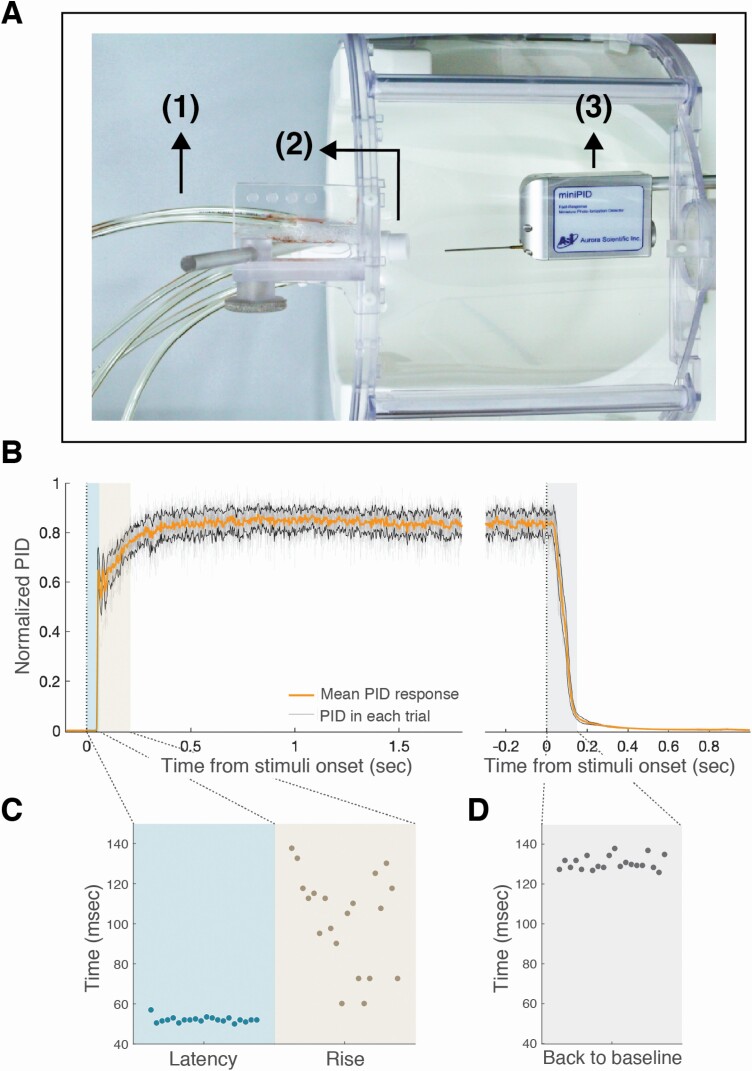
Figure 4.
Odor canopy provided rapid and consistent switching between conditions. (A) Top view of measurement system: odorant line (1), odorant nozzle (2), and PID (3). (B) Averaged response (n = 20) to orange oil, normalized by max response in all epochs, aligned to stimuli onset and stimuli offset, with mean and standard deviation of PID responses in orange and black lines. (C) Latency, rise, and (D) back to baseline times.

