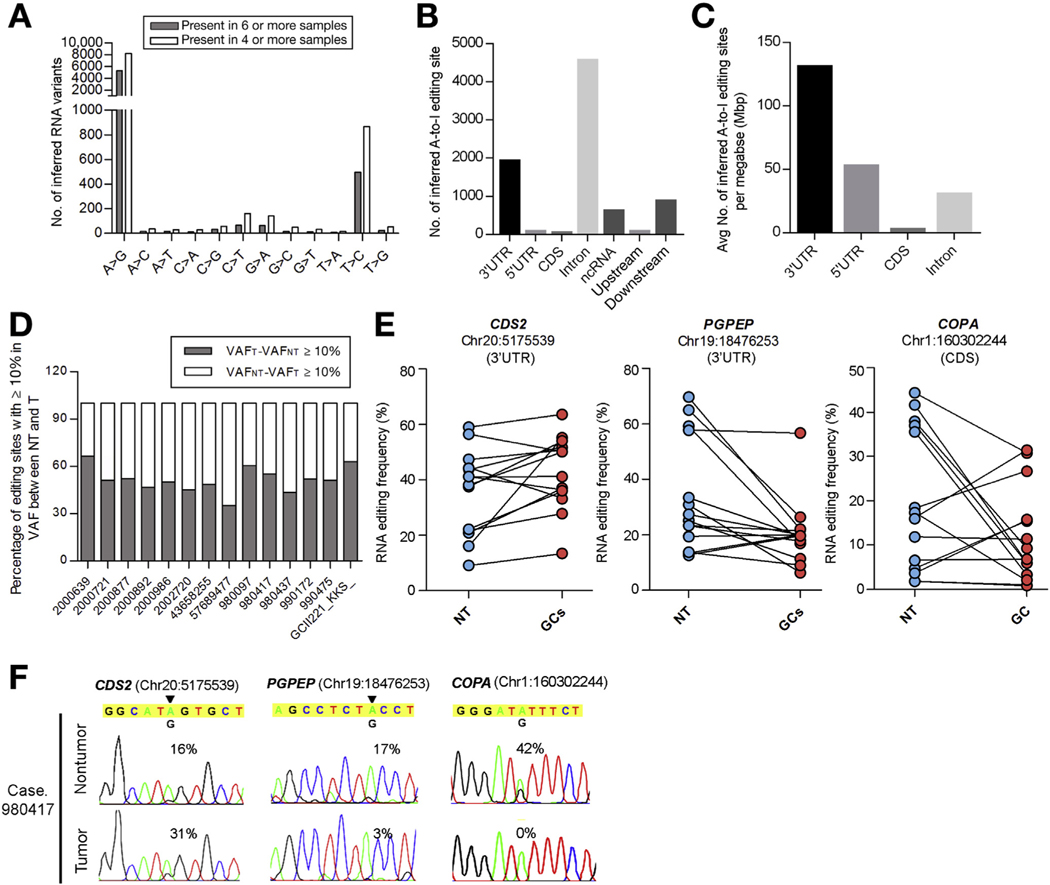
Figure 1.
RNA editome analysis of GC samples by RNA-Seq. (A) Distribution of 12 types of RNA editing sites in GC samples. Data represents a mean number of inferred RNA editing sites detected in the indicated number of samples. (B) Distribution of inferred A-to-I editing sites in each genomic region. (C) Distribution of A-to-I editing sites based on incidence per unit length (mega-base pair [Mbp]). (D) Percentage of A-to-I editing sites (present in ≥4 samples) demonstrating ≥10% increase or decrease in variation frequency (VAF) between gastric tumors (VAFT) and their matched non-tumor (VAFNT) gastric tissues. (E) Editing frequencies of 3 representative editing sites in 14 matched pairs of GCs and NT gastric tissues. (F) Sequence chromatograms of the indicated transcripts in a representative GC case (980417). An arrowhead indicates the editing position and value indicates the editing frequency of the corresponding editing site. Sequence chromatograms of the corresponding genomic DNA (gDNA) and complementary DNA (cDNA) sequences in GC cells are shown in Supplementary Figure 2.

