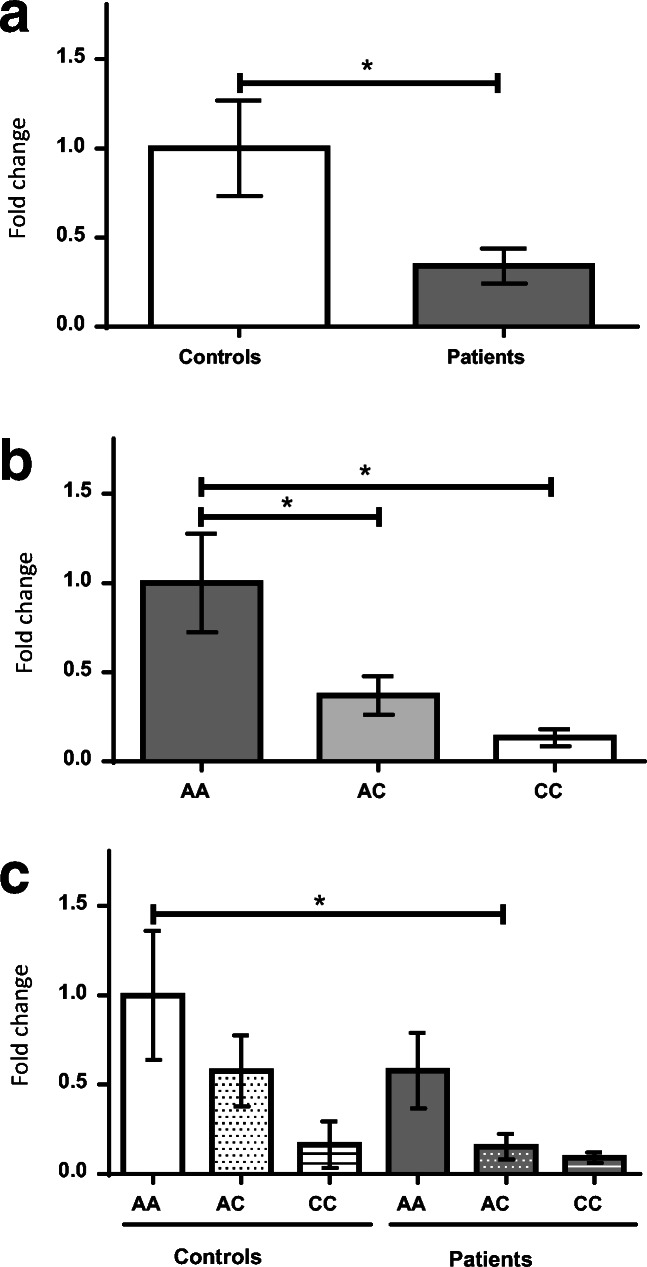
Fig. 1.

FOXP2 expression in the prefrontal cortex of male donor subjects with schizophrenia versus controls (A); accounting for the FOXP2 rs2396753 polymorphism in the total samples (B); taking into consideration the interaction between this polymorphism and the clinical groups (C). FOXP2 expression is indicated as fold changes relative to the control group (A), AA genotype (B) and AA genotype of the control group (C) considering its expression as 1 in each case. Asterisk indicates the degree of significance (* p < 0.05) using an unpaired t test (A) and one-way ANOVA with Bonferroni multiple comparison tests (B and C). Error bars represent standard deviation
