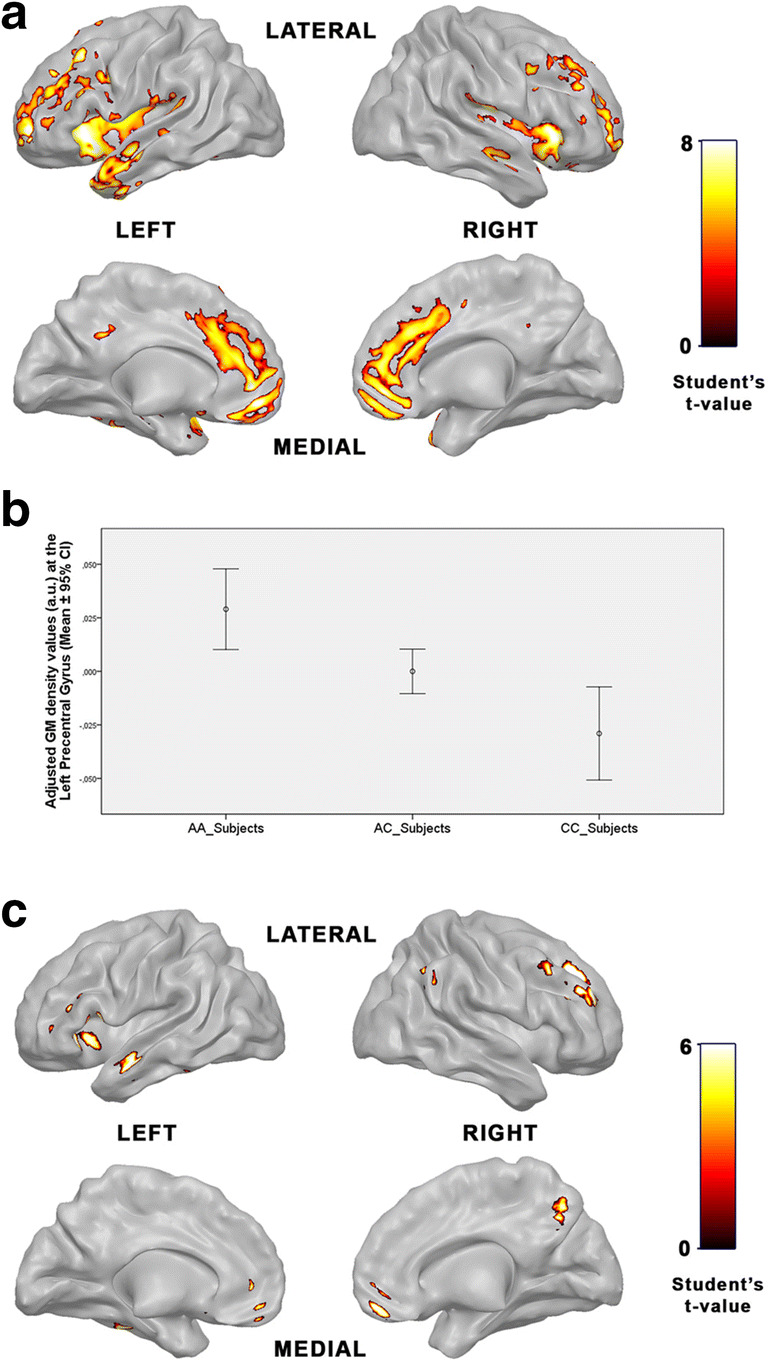
Fig. 2.

Brain imaging data of the male subjects who underwent the MRI examination. Areas with GM density reductions in patients with schizophrenia compared with control subjects, p < 0.05 FWE, k = 65 (A); Distribution of the adjusted GM density values in the left precentral gyrus (-36, 3, 41) concerning the rs2396753 genotypes of FOXP2 in the overall sample (patients and controls).These values are shown as arbitrary units (a.u.). Error bars represent standard deviation (B); Areas with GM density reduction in AC heterozygote patients compared with AC heterozygote controls in terms of the rs2396753, p < 0.05, corrected at voxel level, k = 25 (C)
