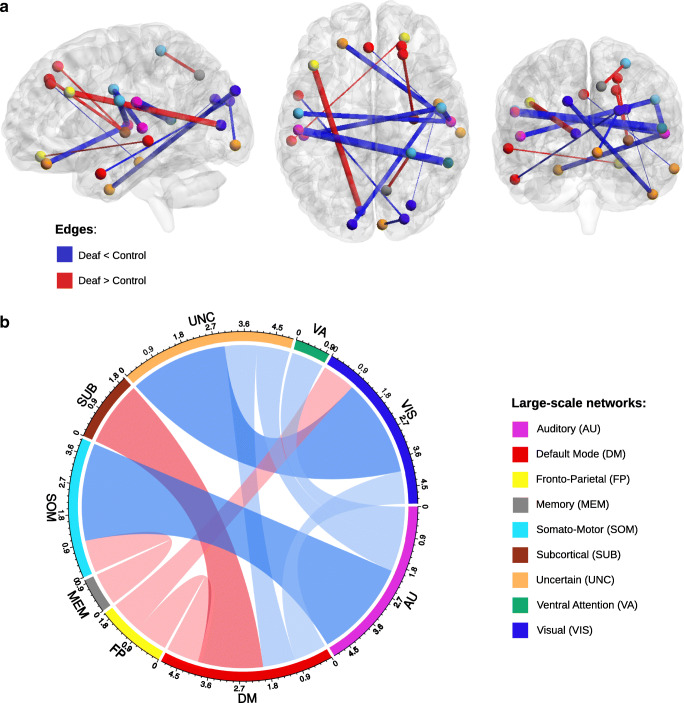
Fig. 1.
Edge-wise functional network differences visualized (a) in brain space and (b) as a chord diagram. (a) Connections that are significantly stronger (red) or weaker (blue) in deaf adults. Edge thickness reflects t-test statistic strength. (b) Chord diagram representing the number of significant edges between different large-scale networks. Red bands represent edges with stronger functional connectivity in the deaf compared to hearing control, while blue bands represent edges with weaker functional connectivity

