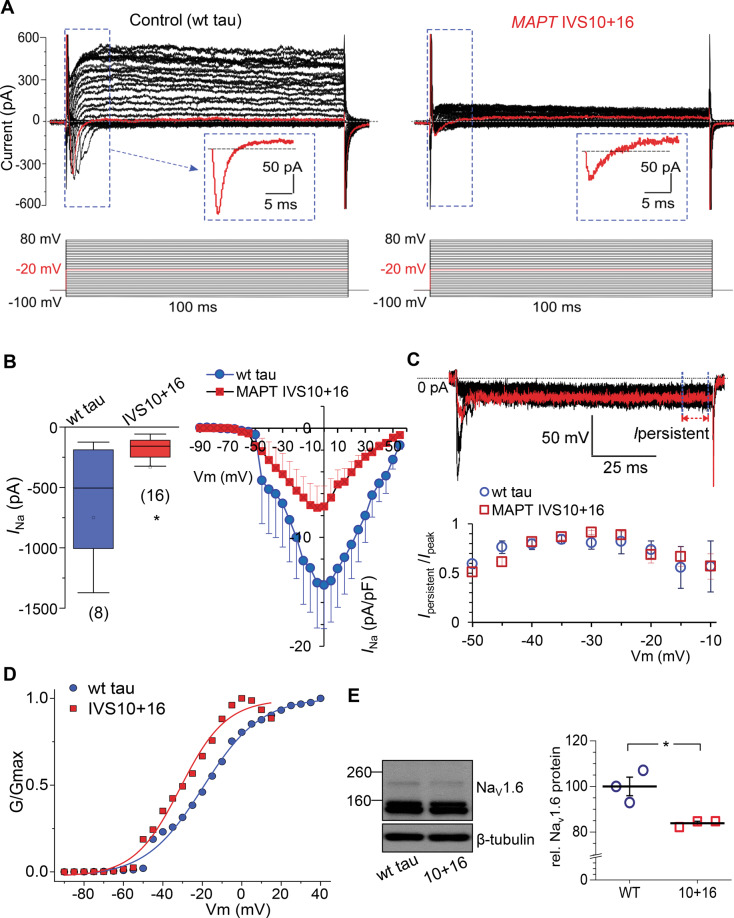
Fig. 3. Pathogenic 4R tau decreases both voltage-gated Na+- and K+-currents, changes Na+-channel property, and reduces Nav1.6 protein level.
A Representative patch-clamp recordings showing inward and outward currents recorded from a control (wild type, wt, tau) iPSC-derived neuron (left) and a MAPT IVS10+16 neuron (right). The protocol consisted of voltage steps from −100 mV to +80 mV, increment of 5 mV (indicated on the bottom). Red line, the current recorded at –10 mV; box depicts the fast-activating and -inactivating current shown on an expanded scale. B Left, statistics for the peak Na+-current (INa) in isogenic control (wt tau) and MAPT IVS10+16 neurons. Boxes show median values; *p < 0.05 (nonparametric Mann–Whitney test). Right, current–voltage (I–V) relationship for the INa recorded from both groups of neurons. Protocol as in (A). C Example of persistent inward current recordings from a MAPT IVS10+16 neuron (voltage steps from −50 mV to −20 mV, increment of 5 mV). Red line, the current recorded at –30 mV; arrow and dashed lines depict persistent currents (Ipersistent). Statistics of the relative persistent current normalized to peak current for each individual cell in wt tau (n = 8 cells) and MAPT IVS10+16 groups (n = 12 neurons) at membrane potentials tested. D Conductance–voltage relationships of INa in wt tau and MAPT IVS10+16 neurons. Conductance was normalized to the maximal INa conductance; lines are Boltzmann fitting. E A representative western blot for the Nav1.6 channel isoform in iPSC-derived neurons at ~200 DIV in wt tau and MAPT IVS10+16 cultures with β-tubulin III as loading control (left), and statistics for the protein expression level of Nav1.6 channel in both groups (n = 3 samples per group). *P = 0.018 (the two-tailed unpaired t-test). All data are mean with s.e.m, unless indicated. The number of tested cells indicated.

