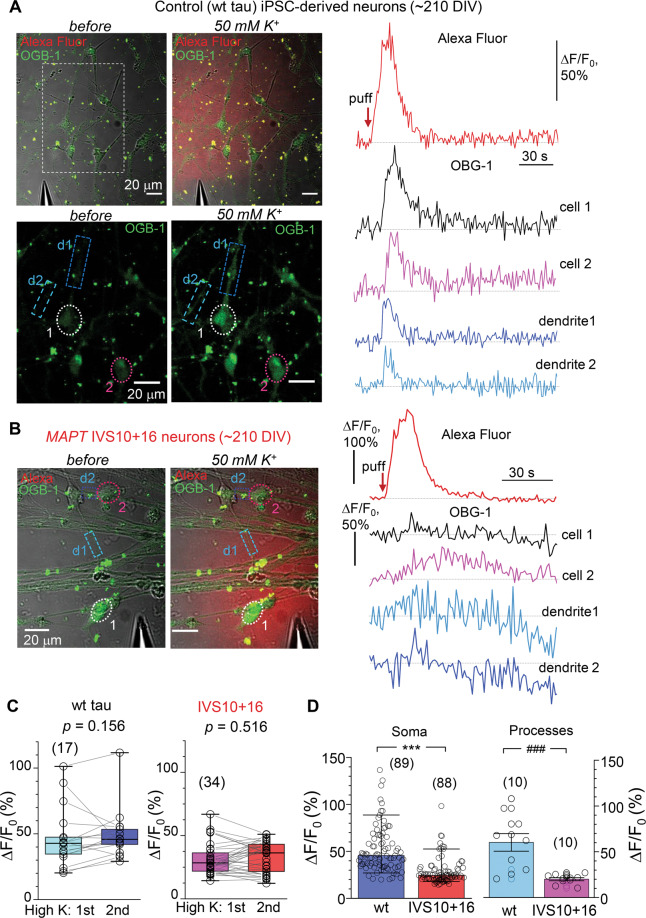
Fig. 6. 4R tau impairs the intracellular Ca2+ mobilization across neuronal compartments upon depolarization.
A Monitoring of depolarization-induced intracellular Ca2+ dynamics using two-photon excitation time-lapse imaging in control (wild type, wt, tau) iPSC-derived neurons (~210 DIV). Images, experimental arrangement for focal application of a high-potassium medium (50 mM) through a micropipette positioned in close proximity of the cells before (left panel) and during a puff of K+ (right panel). Images, combined transmitted light, OGB-1 (green), and Alexa Fluor-594 (red) channels (upper row) and OGB-1 only (lower row); λ2Pex = 800 nm; dotted areas, regions of interest (ROI): cells 1–2 and two neurites, d1 and d2. Plots, the time course of the intracellular Ca2+ rise (ΔF/F0 OGB-1 signal) within indicated ROIs before and following cell depolarization; top trace, Alexa Fluor-594 diffusion profile across the field of view; red arrow, timestamp of K+ puff. B Notations as in (A) but for the MAPT IVS10+16 group. Note the slow and diminished depolarization-induced Ca2+-rise (ΔF/F0 OGB-1 signal), with prolonged decay kinetics, in soma and neurites. C Quantification of the peak Ca2+-rise (ΔF/F0 OGB-1 signal) in response to the two consecutive applications of K+ medium in individual neurons from control (wt tau, n = 17 cells, left bars) and MAPT IVS10+16 groups (n = 34, right). Boxes show median values. The nonparametric paired-sample Wilcoxon signed rank test indicated. D Statistics for the depolarization-induced Ca2+-rise (ΔF/F0 OGB-1 signal) for pooled groups of wt tau and MAPT IVS10+16 neurons recorded in soma (bars show median values, n = 89 cells and 88 cells, respectively, three independent preparations) and within neuronal processes (mean ± SEM, n = 10 per group). ***p < 0.001 nonparametric Mann–Whitney test; ###p < 0.001 ANOVA test.

