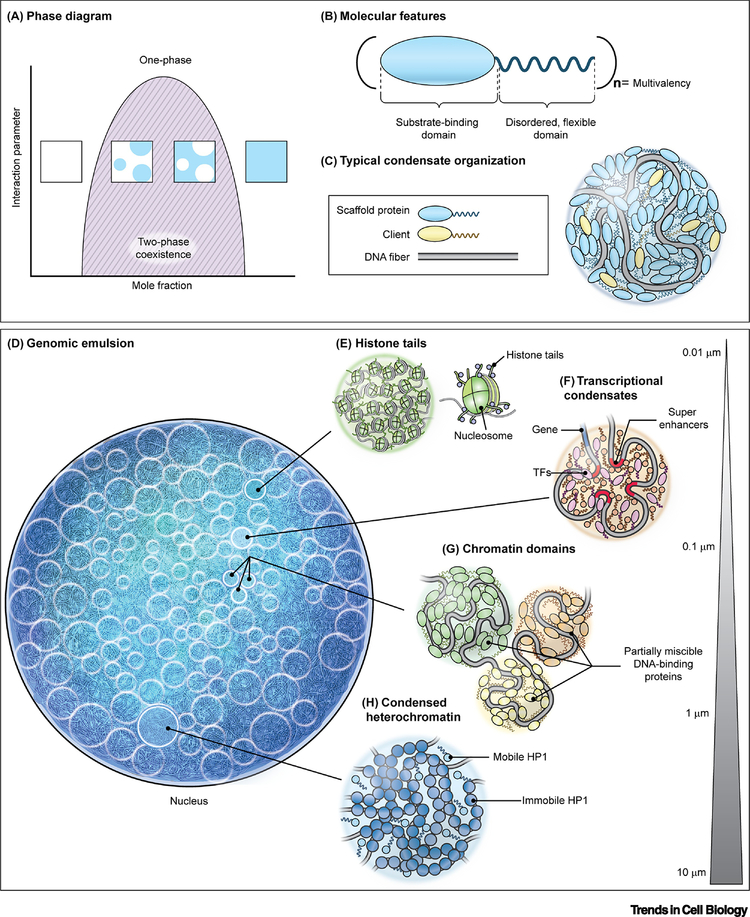
Figure 1. Molecular driving forces of phase separation of the mammalian nuclear genome.
(A) Phase diagram for a simple, two-component system where an interaction parameter, such as temperature, salt concentration, pH, etc., is plotted as a function of concentration of one of the components. The dark solid line represents the boundary between a single, homogenous phase and the two-phase coexistence region. Insets show representative examples of the solution in different regions of the phase diagram. (B) Schematic of a typical phase separating protein. Many phase separating proteins contain substrate-binding (i.e. DNA-binding, protein-interaction) domains and unstructured, disordered domains that can both be arranged in (n) multiplicities, giving rise to multivalent interactions. (C) Representative arrangement of DNA-binding phase separating proteins to form condensates in association with DNA. (D) The nucleus as an emulsion of DNA condensates. (E-H) Levels of phase separation in the nucleus include interactions between histone tails as part of nucleosomal arrays (E), transcriptional condensates involving the interaction of enhancer elements and transcription factors (F), partial miscibility or immiscibility between neighboring chromatin domains (G), and large gene-silenced regions compacted in heterochromatin (H). Bar represents typical length scale of interactions.

