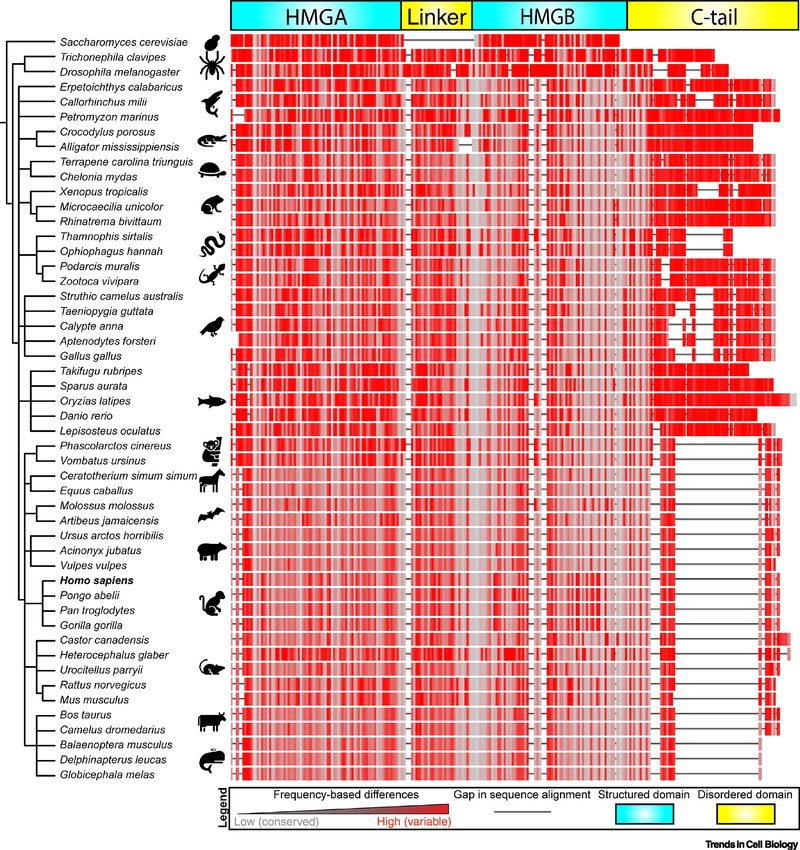
Figure 3. Phylogenetic tree comparing the evolution of TFAM’s modular domains.
FASTA sequences were obtained for fifty representative organisms for TFAM and/or the homologue Abf2 (S. cerevisiae). Organisms were grouped using NCBI Taxonomy Common Tree algorithm, and the generated tree was visualized using the EMBL Interactive Tree of Life (iTOL) tool. Sequences were aligned using the NCBI Cobalt algorithm using default settings, and color coding was assigned based on frequency-based differences, where red indicates highly variable regions with high frequency of mutations and grey indicates highly conserved regions with low frequency of mutations. Sequence gaps are indicated by solid black lines.

