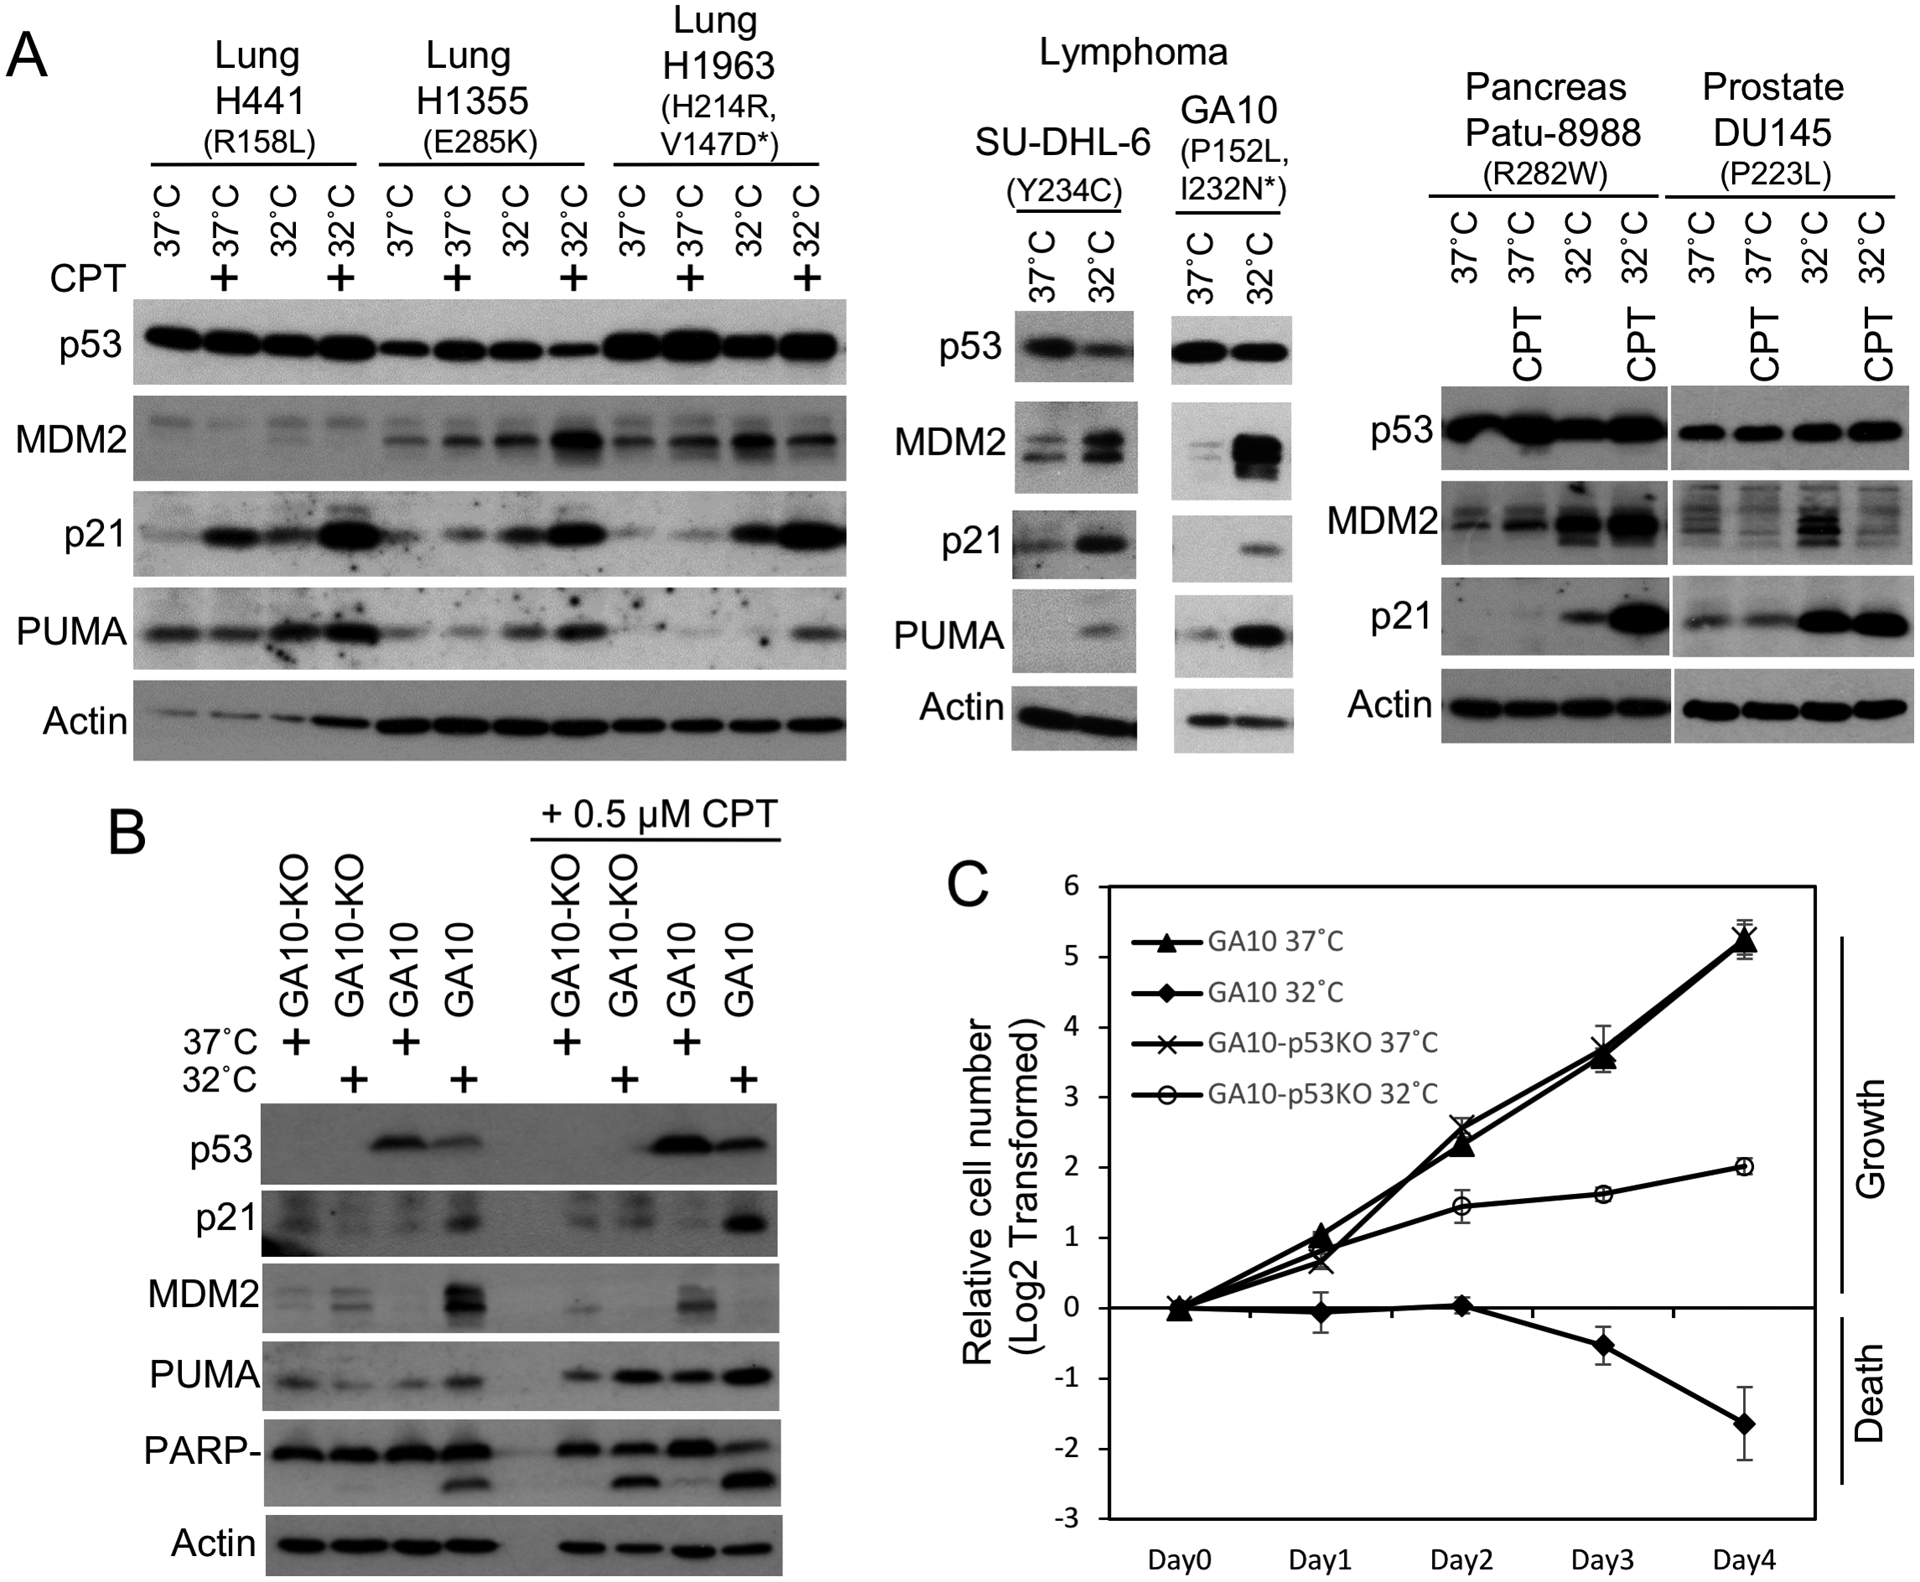
Figure 5. Activation of endogenous ts p53 mutants in tumor cell lines.

(A) Cell lines with endogenous ts mutant p53 (non-ts mutant alleles are marked by *) were cultured at 37°C or shifted to 32°C for 24 hrs and analyzed by Western blot. CPT was added to 0.5 μM where indicated. (B) GA10 cells were infected with lentivirus expressing Cas9 and p53 gRNA. A clonal cell line without p53 was analyzed by Western blot after culturing at 37°C or 32°C for 24 hrs. (C) GA10 cells with and without p53 knockout were seeded at identical starting numbers and cultured at 37°C or 32°C. Cell numbers were counted daily and plotted. The results are average of 3 experiments (mean ± SD).
