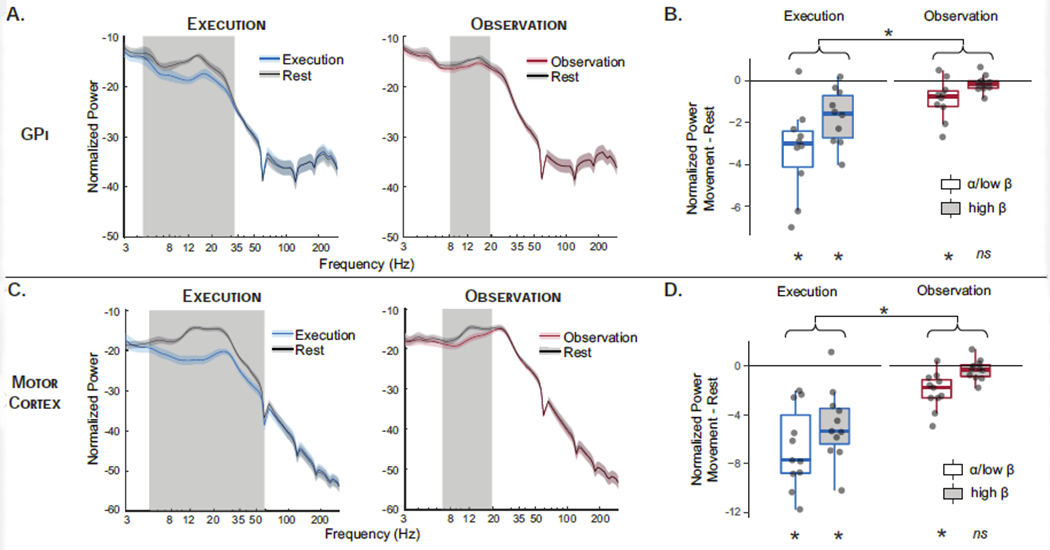
Figure 3.

Spectral Power. Normalized spectral power in globus pallidus internus (GPi) (A) and motor cortex (C) across frequencies for movement and rest blocks during execution (blue) and observation (red). Gray shading indicates frequencies in which movement and rest are significantly different by non-parametric permutation testing with cluster correction for multiple comparisons across frequencies. Boxplots show band-averaged power modulation (α/low-β = 8-17.9 Hz; high-β = 18-35 Hz) in GPi (B) and motor cortex (D) during movement relative to rest (movement – rest change score) for execution (blue) and observation (red) tasks. Significant modulation by movement (e.g. significant difference from zero by Wilcoxon signed rank tests) is indicated at bottom. Main effect of task is indicated at top; main effect of frequency band was also significant but not shown for readability. Given the absence of a two-way interaction, simple effects were not tested. (* p<0.05 Bonferroni corrected, ns non-significant.)
