
Figure 5. Kaplan Meier plots stratified by TOLD MRI.
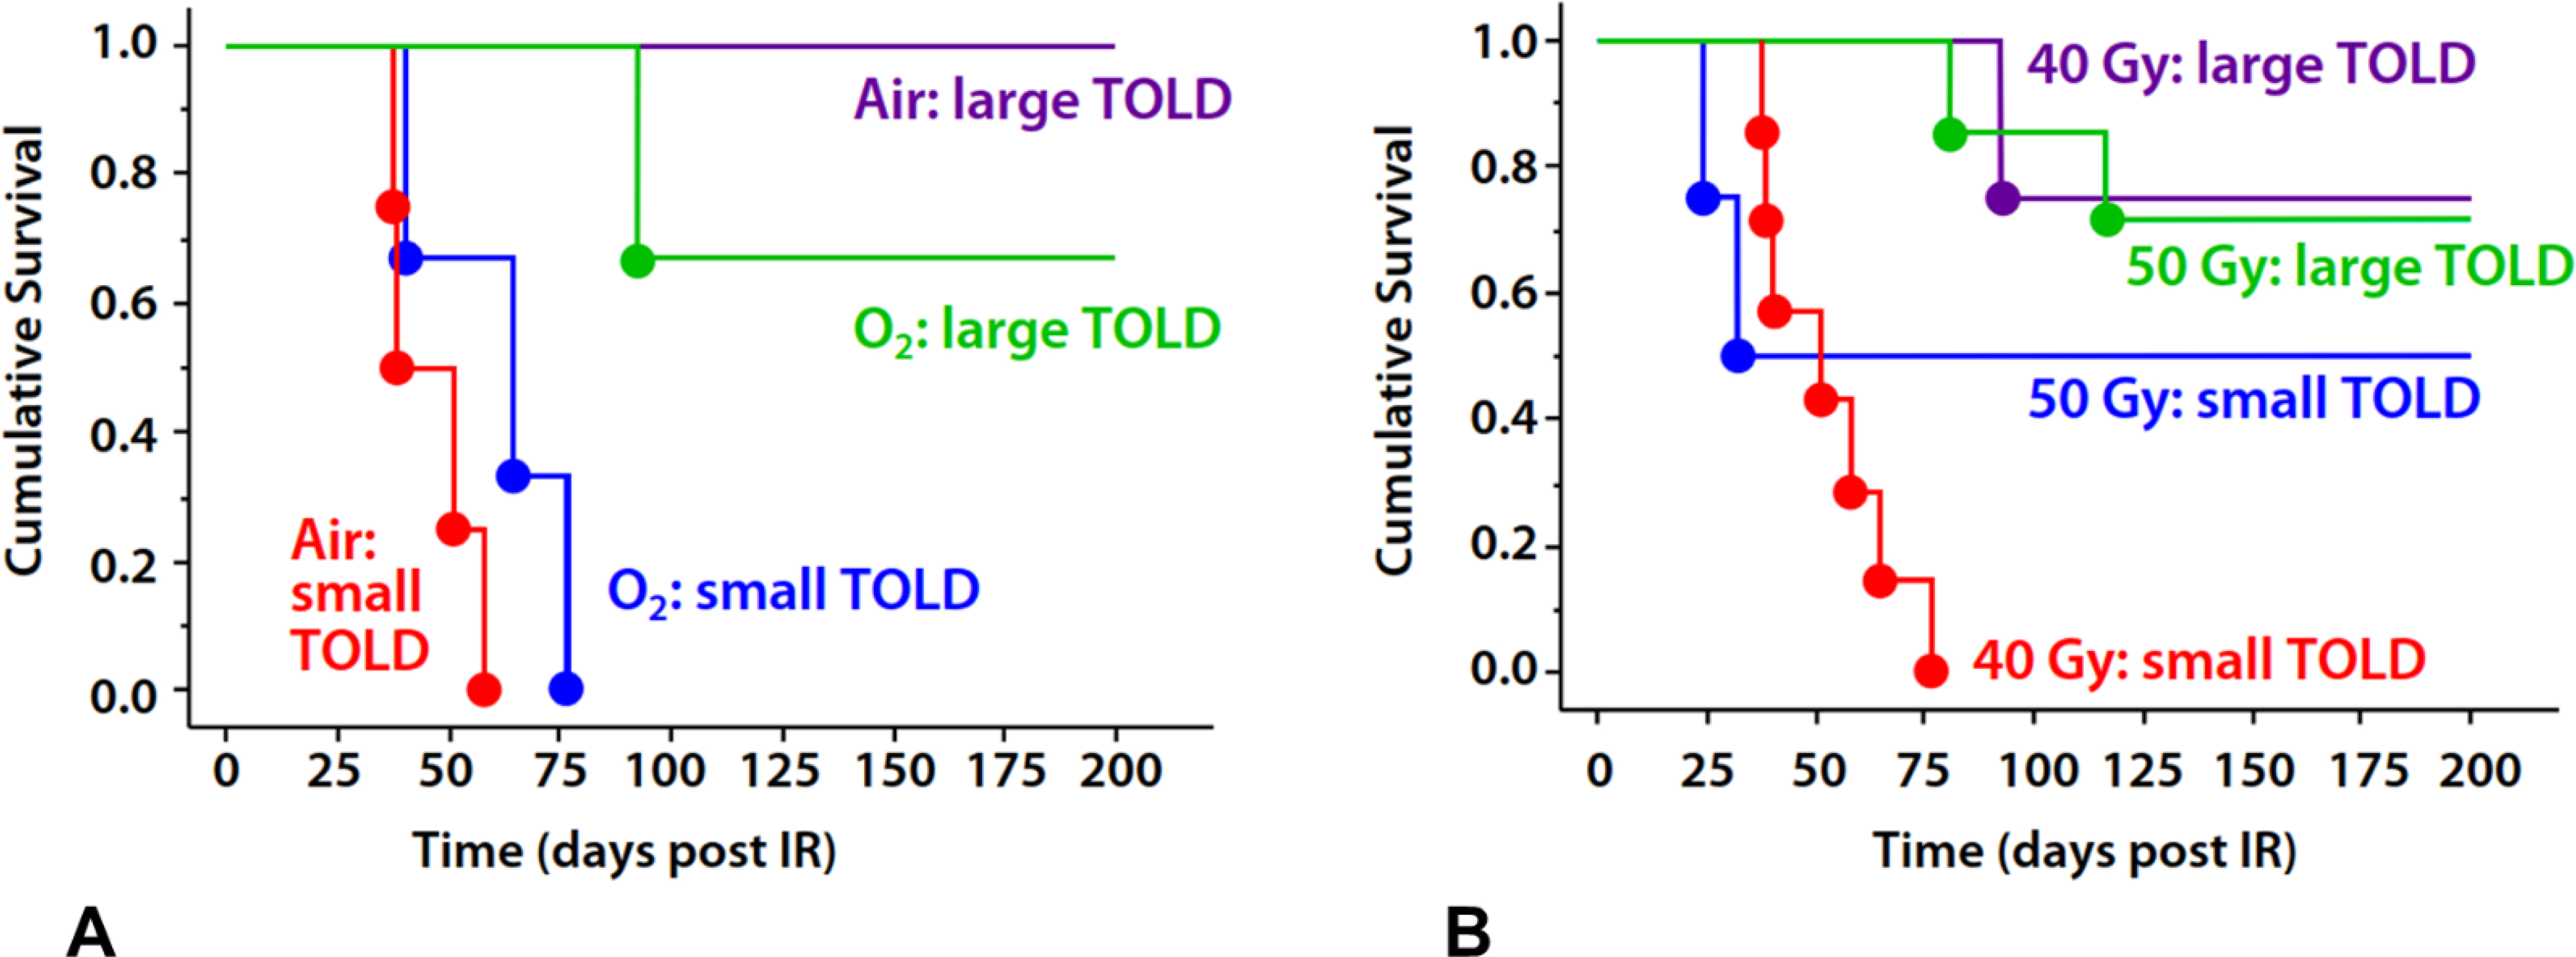
A) Tumors exhibiting small TOLD response (<0.922%ΔSI) showed poor tumor control following a single dose of 40 Gy whether the rats breathed air (red, n=4) or oxygen during irradiation (blue, n=3). Meanwhile, those tumors exhibiting a large TOLD response showed effective control irrespective of inhaled gas (green and purple, n=3 and 1 and respectively)
B) Noting the similarity of response irrespective of inhaled gas, we combined groups in (A) to show curves for mixed cohorts, which include both air and oxygen, gas breathing rats. It is seen that tumors showing a small TOLD MRI response to pre-irradiation oxygen breathing challenge were not controlled whether breathing air or oxygen during irradiation (red). Applying a higher radiation dose (50 Gy) to tumors showing small TOLD response improved tumor control in 50% of tumors (blue). Well oxygenated tumors, characterized by a large TOLD response showed similar control with 40 or 50 Gy irrespective of inhaled gas (purple and green).