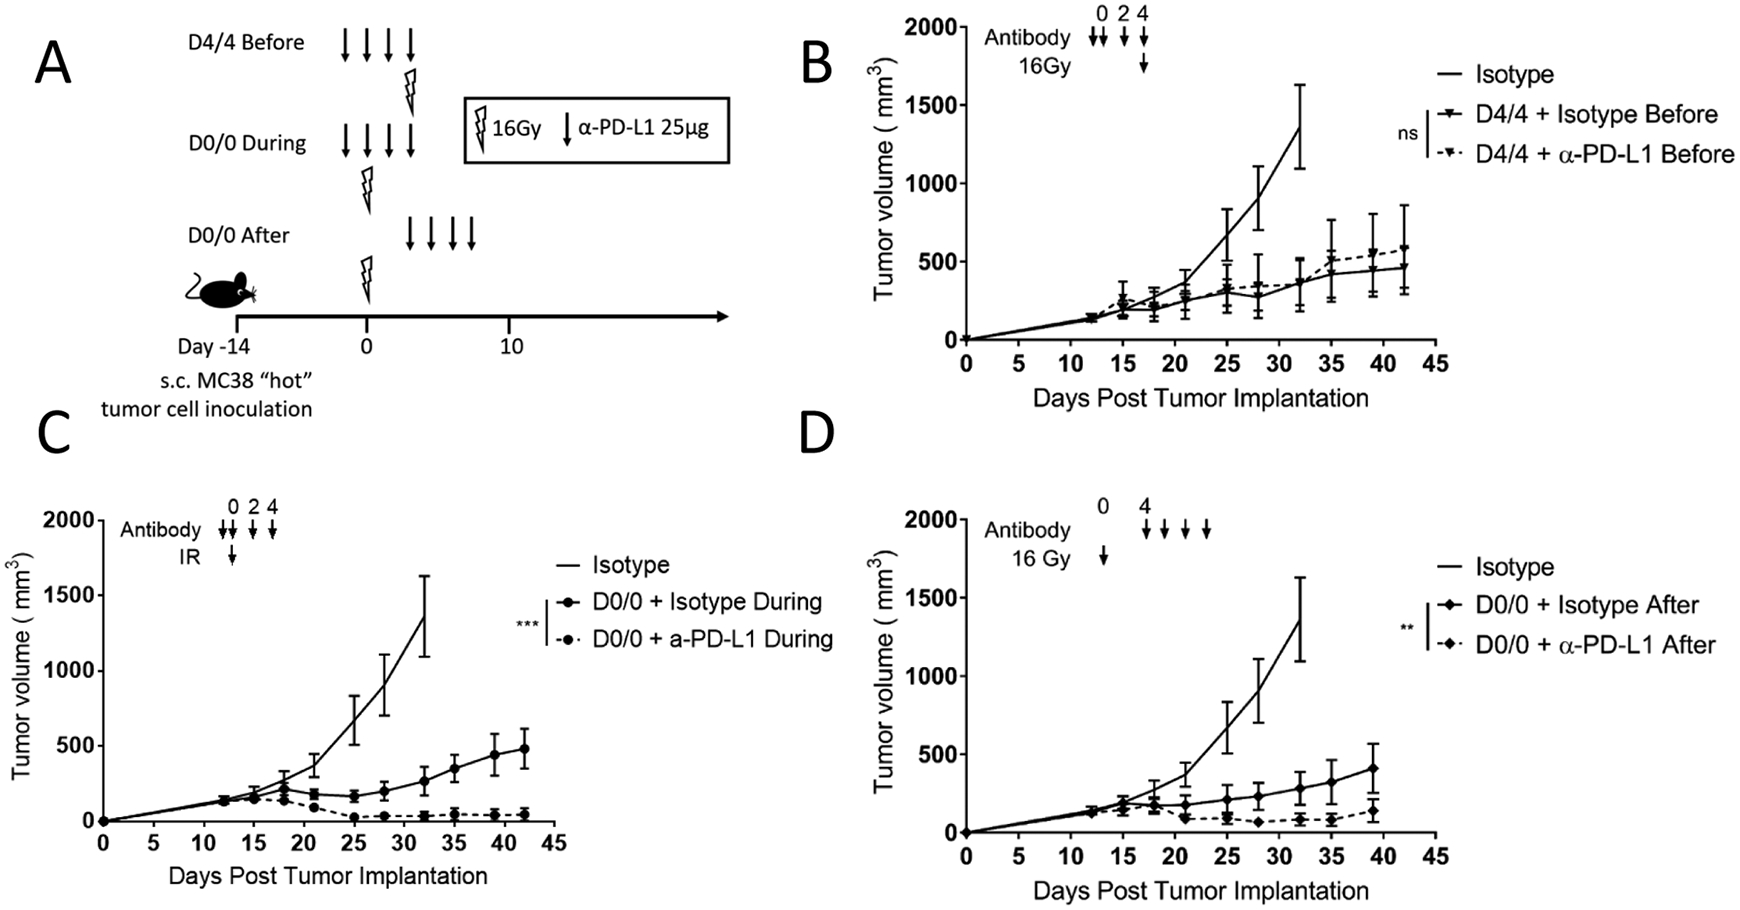
Figure 1. Sequence of immunotherapy and radiation therapy within radio-immunotherapy pulses impact tumor growth.

(A) Diagram representing the treatment timeline for panels B–D. 1×10⁶ MC38 cells were injected subcutaneously in the right leg on day −14, and three different combination α-PD-L1 + 16Gy radiation schemes were given as shown. Arrow represents α-PD-L1 or isotype dose, lightning bolt indicates radiation dose.
(B–D) Mice were treated as described in (A) and as shown with arrows above the tumor curves. The same isotype control mice are shown in each panel for relative comparison, as all tumor curves in these panels were collected in the same experiment. Tumor volume was measured, and the results are presented as mean ±SEM, IR irradiation, ns not significant, ** p < 0.01, *** p < 0.001, n=7/group.
