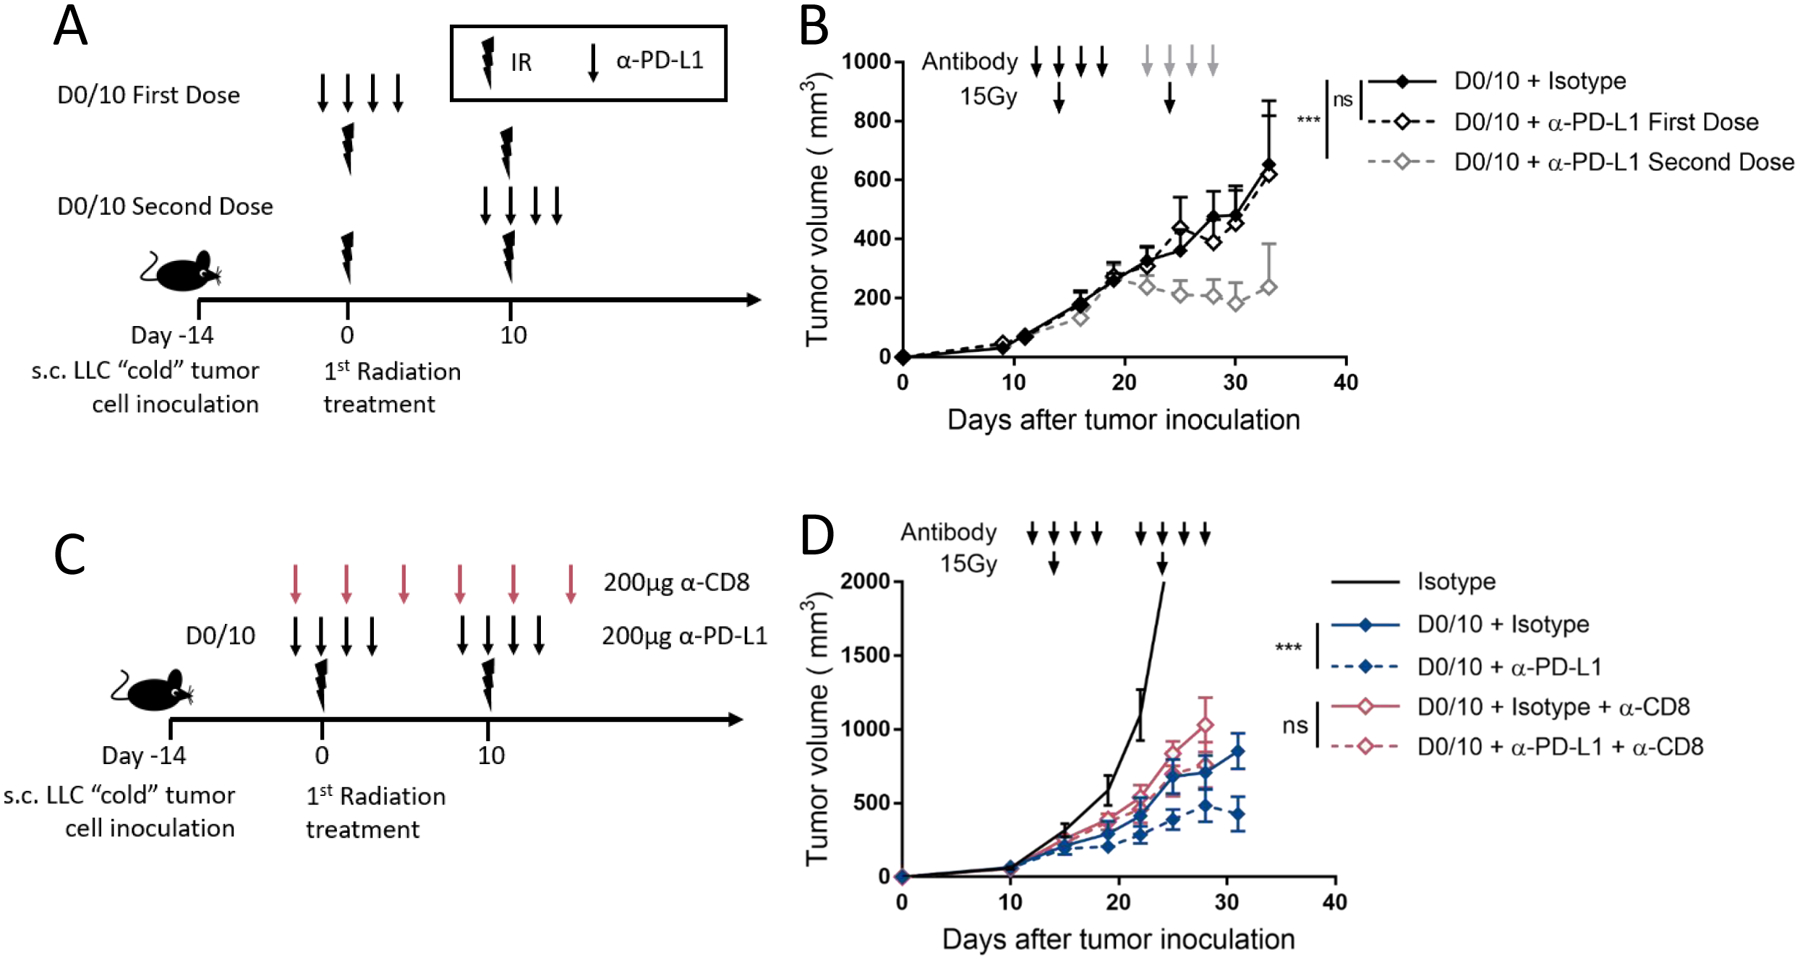
Figure 5. Only the second dose of α-PD-L1 is required for CD8+ T cell dependent therapeutic efficacy in the non-immunogenic LLC model.

(A)Diagram representing the treatment timeline for panel B. 1×10⁶ LLC cells were injected subcutaneously (s.c.) in the right leg on day −14, and 15Gy radiation was given 10 days apart starting on day 0. α-PD-L1 (200μg) or isotype control (200μg) was given with either the first or second radiation fraction. Arrow represents α-PD-L1 or isotype dose, lightning bolt indicates radiation dose.
(B) Mice were treated as described in (A) and as shown with arrows above the tumor curves. The solid black line represents control mice only receiving two doses of 15Gy and isotype control antibody. The dashed black group represents mice treated with two doses of 15Gy with α-PD-L1 given during the first dose of radiation (black arrows). The dashed grey group represents mice treated with two doses of 15Gy with α-PD-L1 given during the second dose of radiation (grey arrows). Tumor volume was measured, and the results are presented as mean ±SEM, IR irradiation, ns not significant, ** p < 0.01, n=8 or 9/group.
(C) Diagram representing the treatment timeline for panel D. 1×10⁶ LLC cells were injected s.c. in the right leg on day −14, and treated with two fractions of 15Gy radiation 10 days apart starting on day 0 after tumor cell implantation. α-PD-L1 (200μg) or isotype control (200μg) was given starting two days before each radiation dose and continuing for 2 doses after radiation. α-CD8 depleting antibody (200μg) was given on the first day of treatment and every 4 days for 3 weeks. Lower arrow represents α-PD-L1 or isotype dose, upper arrow represents α-CD8 depleting antibody dose, lightning bolt indicates 15Gy radiation dose.
(D) Mice were treated as described in (C) and as shown with arrows above the tumor curves. Tumor volume was measured, and the results are presented as mean ±SEM, IR irradiation, ns not significant, ** p < 0.01, n=8 or 9/group.
