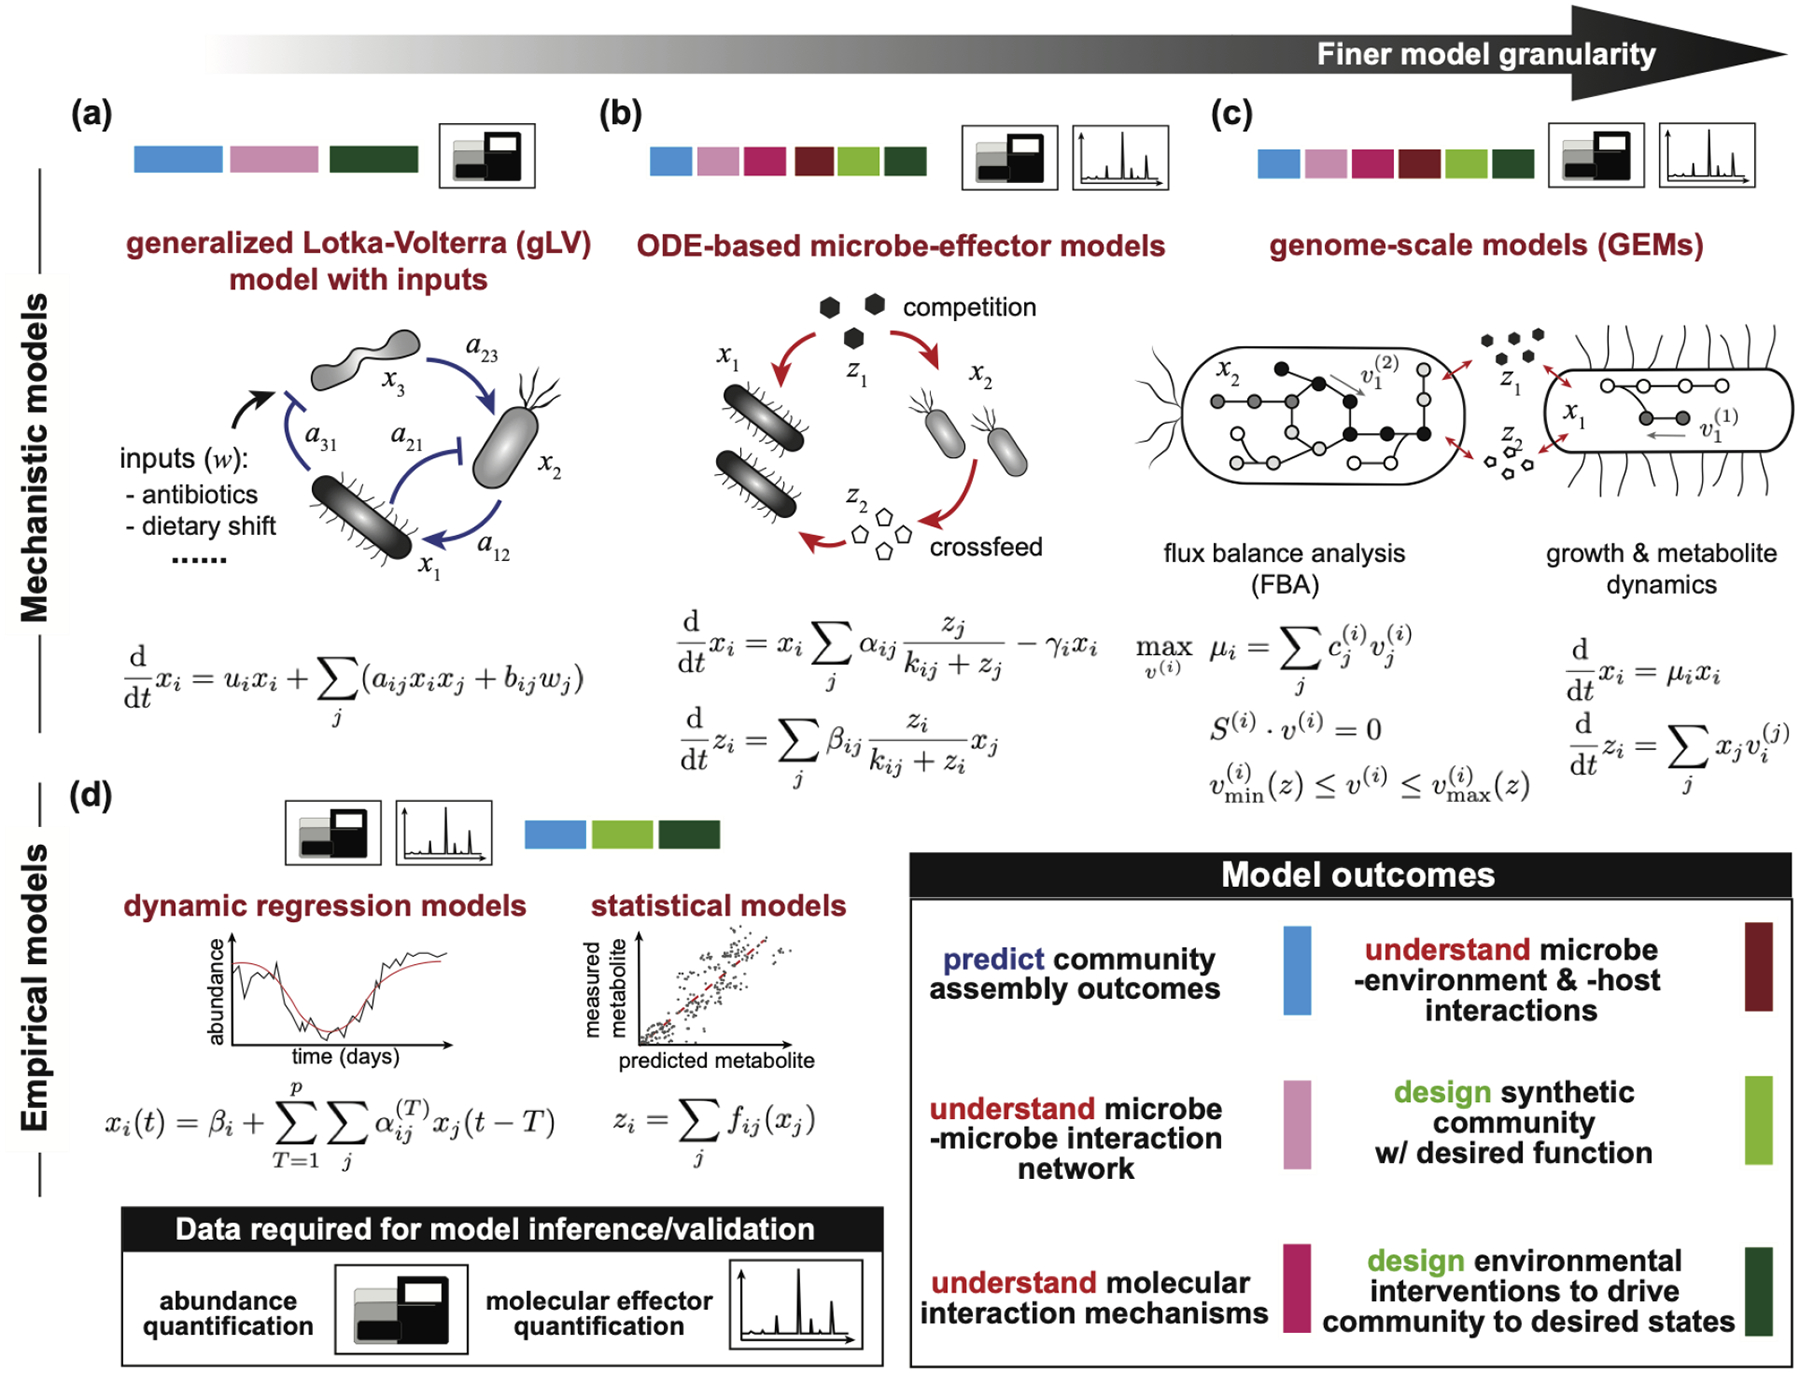
Figure 1. Modeling frameworks available at various scales to develop dynamic models for microbial communities.

(a) Generalized Lotka-Volterra (gLV) models with an input can describe how the absolute abundance of community member i (xi) changes with the abundance of other community members and with external inputs w. Parameter bij describes the effect of the j-th input on member i. Effect of member j on the growth of member i is represented by a constant interaction coefficient aij, and ui is the basal growth rate of member i. (b) Ordinary differential equation (ODE) based microbe-effector models describe how species abundance (x) variation depends on metabolite concentration (z), and how, in turn, metabolite concentration changes dynamically with species abundance through uptake and release. Parameter αij describes the maximum growth rate of member i using resource j, γi is the death rate of member i, and βij is the uptake/release rate of metabolite i by member j. (c) Genome scale models can be used to simulate community dynamics. The equations show dynamic multispecies metabolic modeling framework as described in [26]. At each time interval, the metabolic fluxes (v(i)) and growth rate (μi) of each community member i is determined using FBA and the species’ genome-scale model (GEM). The fluxes of metabolite exchange reactions are then used to update the metabolite concentration in the environment. The uptake rates of metabolites from the environment depend on extracellular metabolite concentrations. Hence, the bounds of exchange fluxes (v(i)min and v(i)max) are generally functions of extracellular metabolite concentration, which often take Michaelis-Menten form. (d) Dynamic regression models assume that species abundance at time t can be written as a combination of previous p abundance measurements x(t-1)…x(t-p). The equation shows an example of the vector autoregression framework in [29]. Previous external inputs can also be included in these models to predict community member abundances in the presence of inputs (not shown in the figure). Static regression models have been used to map species abundance to molecule concentrations [28]. Model outcomes: Each colored square indicates a modeling framework’s ability to solve a class of scientific or engineering problems in microbial communities as shown in the legend. The required types of data to infer and validate each model are indicated by schematics for abundance and molecular effector quantification.
