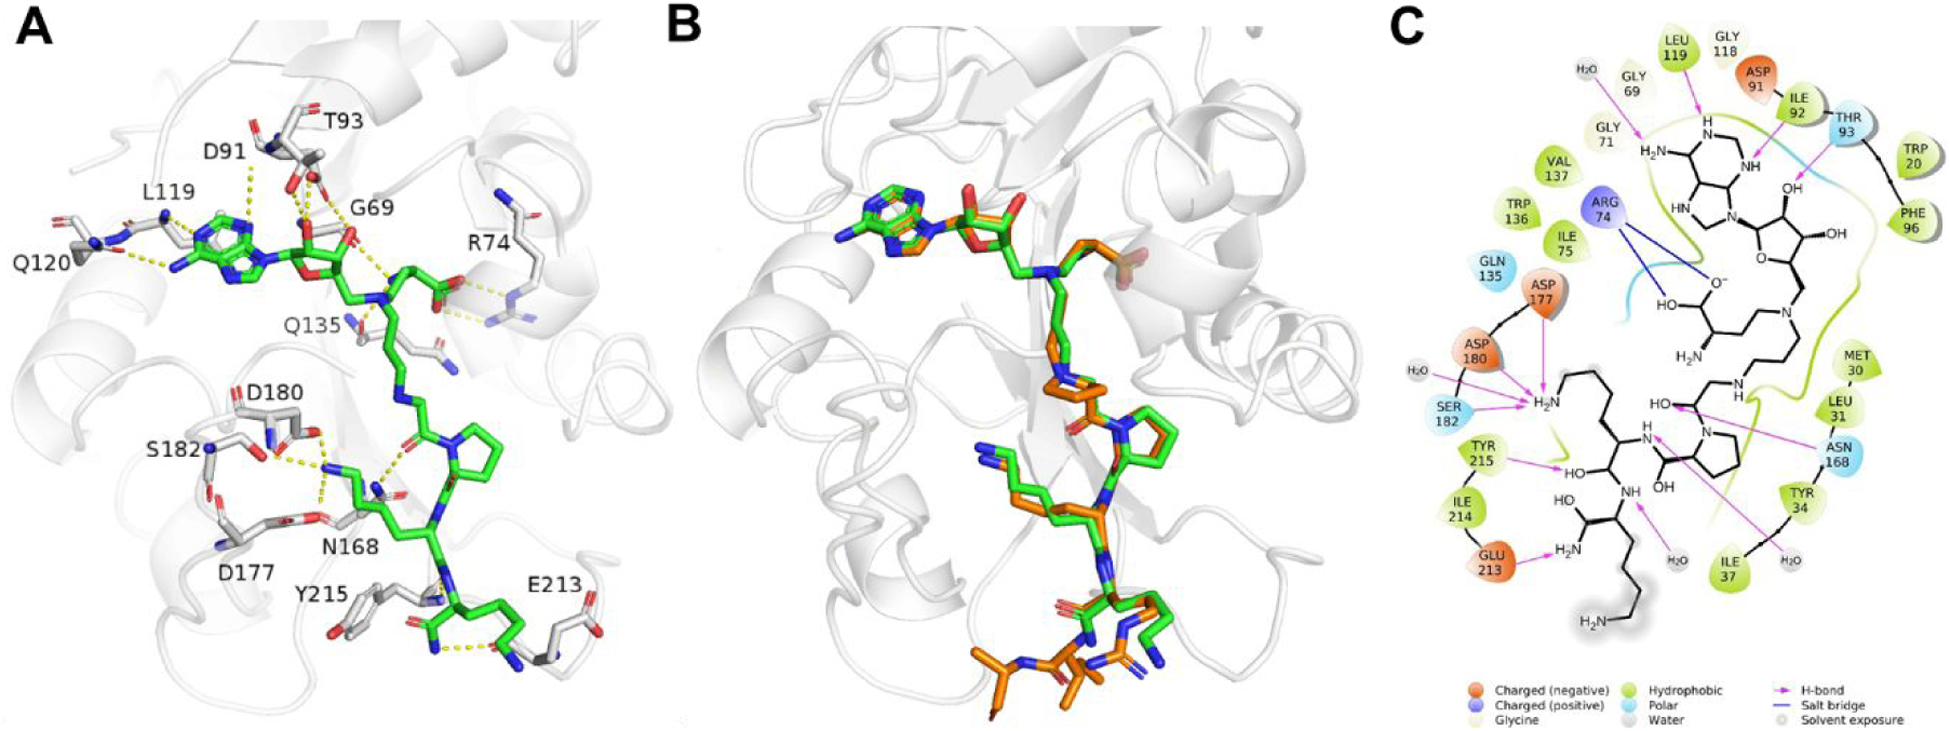
Figure 3.

X-ray co-crystal structure of NTMT1- 1 (PDB ID: 6PVA). (A) Zoomed view of interactions of 1 (green) complex with NTMT1(gray). H-bond interactions are shown in yellow dotted lines; (B) Structural alignment of NTMT1(gray)-1 (green) complex with NTMT1-NAH-C3-PPKRIA (orange) binary complex (PDB ID: 6DTN); (C) 2D interaction diagram (Schrödinger Maestro) of 1 with NTMT1.
