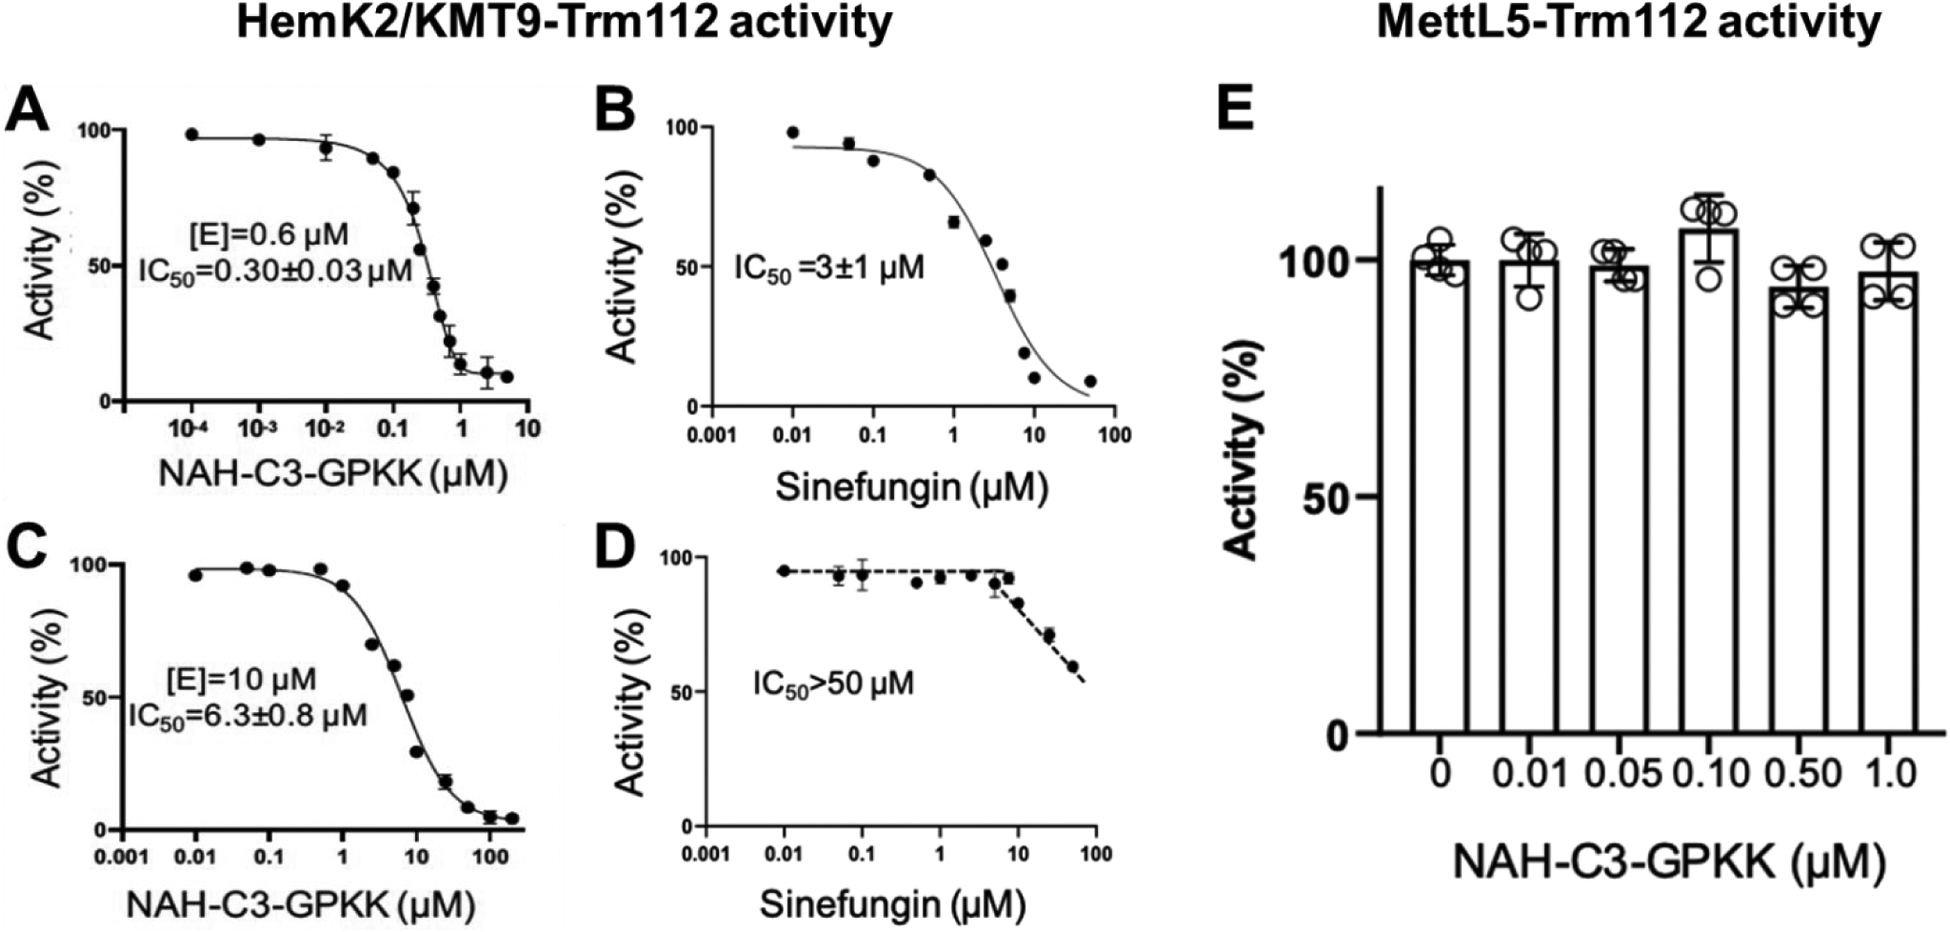
Figure 5.

(A) and (B) IC50 curves of compound 1 (NAH-C3-GPKK) and sinefungin for HemK2/KMT9-Trm112 activity on a GGQ peptide (n=3). The concentration of the HemK2/KMT9-Trm112 complex was 0.6 μM; (C) and (D) IC50 curves of compound 1 (NAH-C3-GPKK) and sinefungin for HemK2/KMT9-Trm112 activity on a GGQ peptide (n=3). The concentration of the complex was 10 μM; (E) compound 1 (NAH-C3-GPKK) for MettL5-Trm112 activity (n=3). The concentration of the complex was 0.2 μM.
