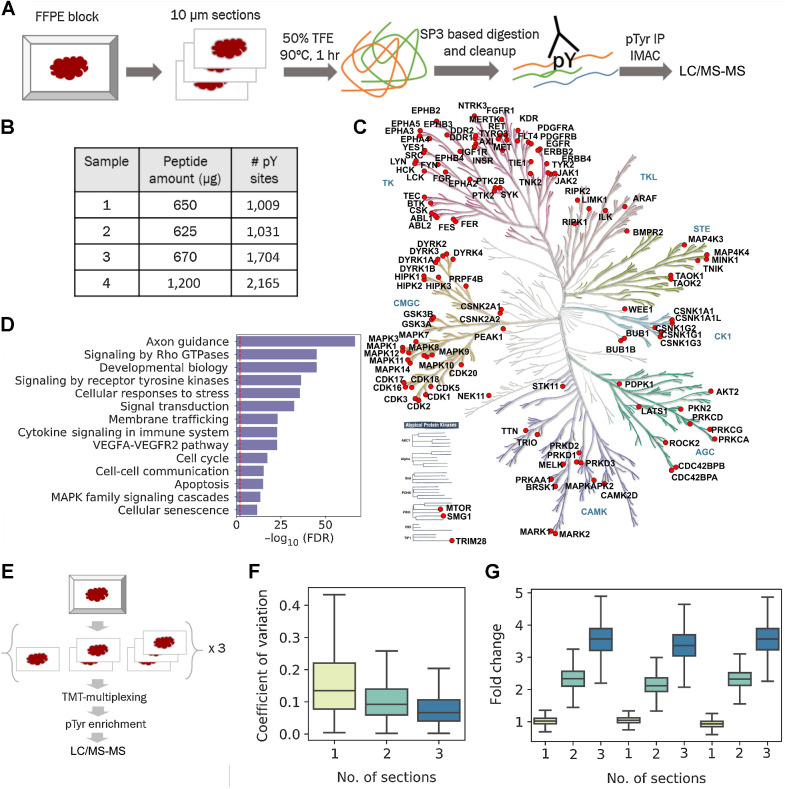
Figure 1.
Phosphotyrosine analysis from 10-μm sections of FFPE tissues. A, Optimized workflow for extraction and digestion of proteins from FFPE tissues followed by two-step enrichment of pTyr peptides for LC/MS-MS analysis. B, Number of pTyr sites identified from multiple 10-μm sections of GBM6 PDX tumors. C, Kinome tree depicting pTyr-containing proteins identified in PDX tumors. D, Selected reactome pathways enriched in gene ontology analysis of pTyr proteins. Dashed red line depicts FDR = 0.01. E, Schematic workflow for a multiplexed pTyr analysis of one, two, or three 10-μm sections of FFPE tissues in triplicate. F, CV observed across multiple sections of FFPE tissues (n = 3 replicates). Median CV for one, two, or three sections was 13.5%, 9.2%, and 6.7%, respectively. G, Fold change of TMT intensities of peptides quantified in each channel compared with the average of TMT intensities from single sections on a peptide basis. Error bars represent interquartile range.

