. 2021 May 20;81(14):3930–3941. doi: 10.1158/0008-5472.CAN-21-0214

Figure 5.

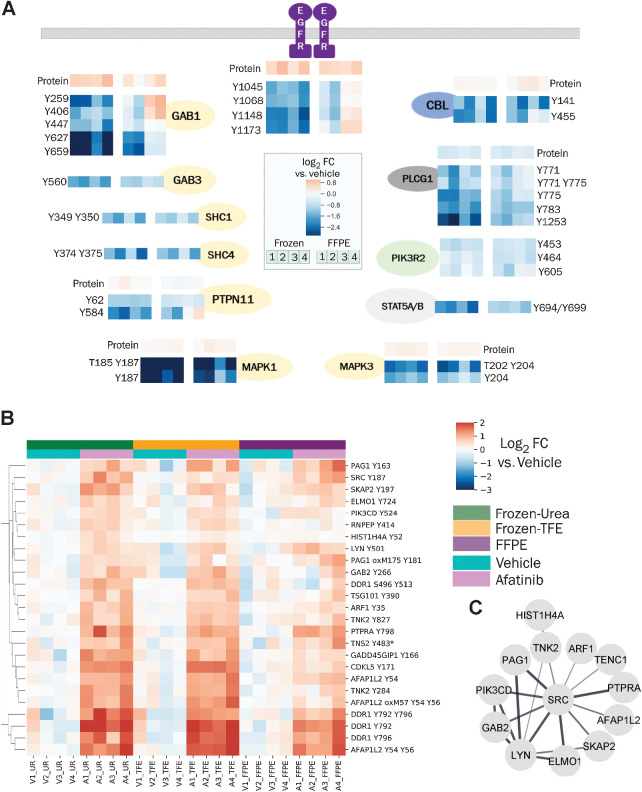
Figure 5. Changes in pTyr and protein levels in response to afatinib treatment. A, Diagram of EGFR pathway showing the effect of afatinib treatment on selected pTyr sites in various proteins as quantified in Frozen-Urea and their FFPE counterparts. Protein or pTyr levels are represented as log2 fold change (FC) relative to vehicle control. B, Hierarchical clustering heatmap of pTyr sites that were significantly upregulated (fold change > 1.4 and FDR q-value < 0.05 after Benjamini–Hochberg multiple hypothesis testing correction) in response to afatinib treatment in Frozen-Urea workflow. Phosphotyrosine levels are represented as log2 fold change relative to vehicle control. Miscleaved peptides are denoted by * next to them. C, Interaction network of pTyr proteins from B obtained from STRING database. All of the interactions are at least medium confidence based on all interaction sources except text mining. Noninteracting proteins are not shown.

Changes in pTyr and protein levels in response to afatinib treatment. A, Diagram of EGFR pathway showing the effect of afatinib treatment on selected pTyr sites in various proteins as quantified in Frozen-Urea and their FFPE counterparts. Protein or pTyr levels are represented as log2 fold change (FC) relative to vehicle control. B, Hierarchical clustering heatmap of pTyr sites that were significantly upregulated (fold change > 1.4 and FDR q-value < 0.05 after Benjamini–Hochberg multiple hypothesis testing correction) in response to afatinib treatment in Frozen-Urea workflow. Phosphotyrosine levels are represented as log2 fold change relative to vehicle control. Miscleaved peptides are denoted by * next to them. C, Interaction network of pTyr proteins from B obtained from STRING database. All of the interactions are at least medium confidence based on all interaction sources except text mining. Noninteracting proteins are not shown.