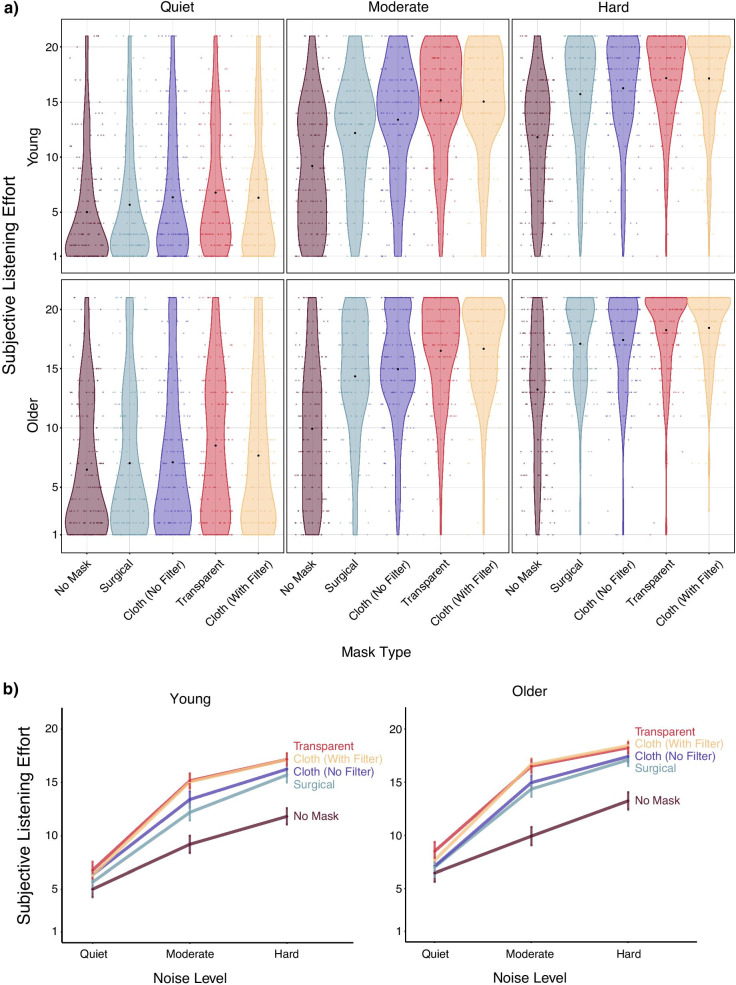
Fig. 3.
Subjective listening effort in young and older adults. Note. a Young and older adults’ subjective listening effort ratings for each mask type by noise level. Black dots indicate the mean effort rating in each condition, and colored dots indicate means for individual participants. b Line graphs showing subjective listening effort ratings by noise level for each mask type in young and older adults. Error bars indicate ± two standard errors. Note that the bottom panel conveys the same information as the top panel but more clearly displays how noise affects subjective effort across mask types. Responses range from 1–21

