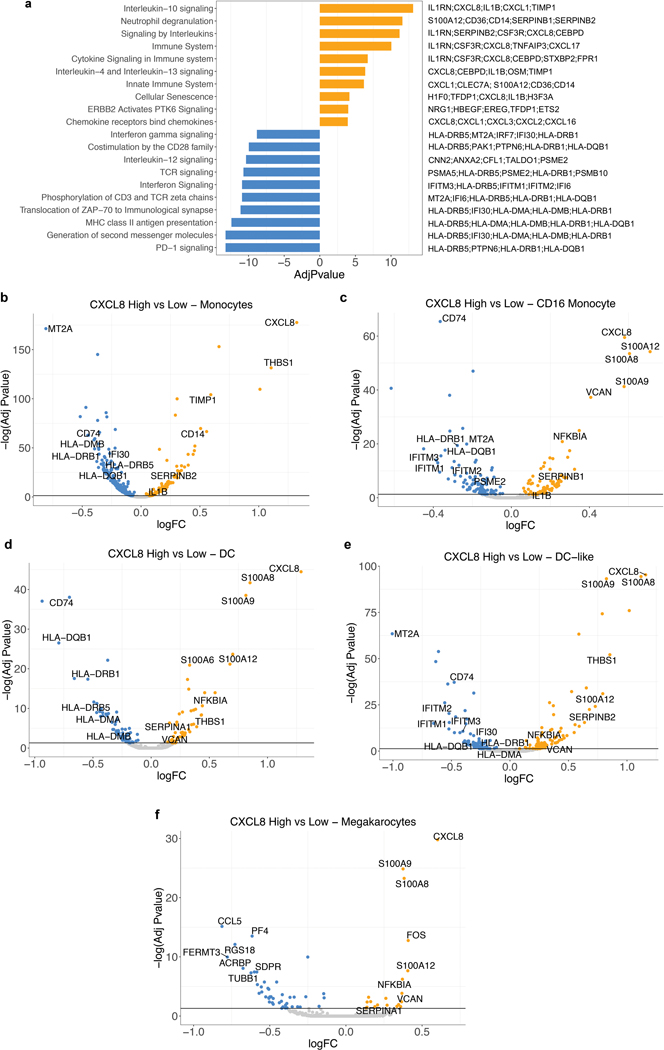
Extended Data Fig. 6. Differential expression analysis of IL8 expression in myeloid cells.
a, Gene set enrichment REACTOME pathways analysis between IL8 high vs IL8 low cells (median cutoff) in all myeloid clusters (n=8374). Differential expression analysis with the generalized linear models (glm)-based statistical methods of the edgeR package with Benjamini & Hochberg corrections. Normalized enrichment scores, log FDR corrected, are shown in x axis. Top 10 pathways associated with IL8 high myeloid cells were shown in orange and top 10 pathways associated with IL8 low myeloid cells were shown in blue. b, Differential gene expression of IL8 high vs low populations in different myeloid clusters: a, Monocytes (n=6761), b, CD16 Monocytes (n=623), c, DC (n=391), d, DC-like (n=305) and e, Megakaryocytes (n=294). Differential expression analysis with the generalized linear models (glm)-based statistical methods of the edgeR package with Benjamini & Hochberg corrections. Genes that are enriched in IL8 high are shown in orange and those that are enriched in IL8 low are shown in blue.

