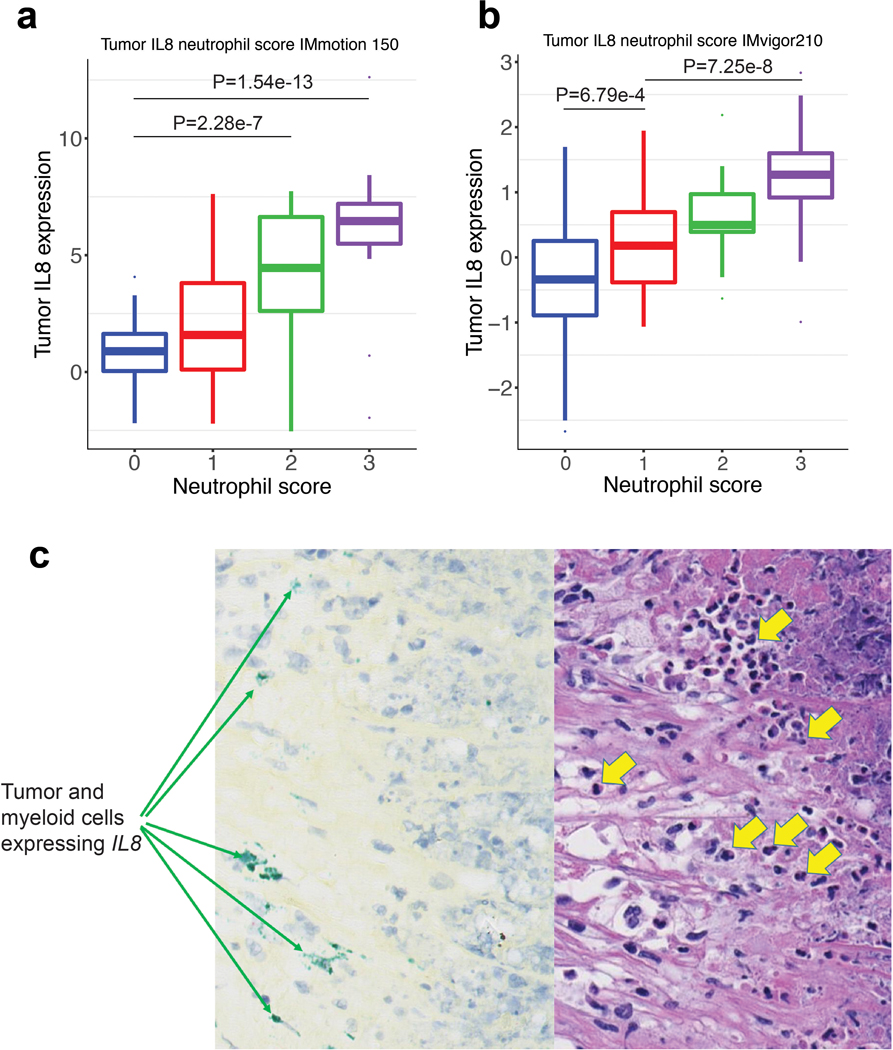
Extended Data Fig. 9. Correlation of IL8 gene expression and neutrophil score in bladder and RCC tumors.
IL8 gene expression and histological assessment of neutrophils by H&E stain in a, mRCC (IMmotion 150) (n=100) tumors. Neutrophil score 0 (n=37): minima: −2.19, maxima: 4.07, and Percentile 75%: 1.63, 50%: 0.89, 25%: 0.04. Neutrophil score 1 (n=24): minima: −2.21, maxima: 7.62, and Percentile 75%: 3.8, 50%: 1.5, 25%: 0.10. Neutrophil score 2 (n=18): minima: −2.54, maxima: 7.72, and Percentile 75%: 6.63, 50%:4.45, 25%:2.6. Neutrophil score 3 (n=21): minima: −1.96, maxima:12.6, and Percentile 75%: 7.20, 50%: 6.46, 25%: 5.49. P values are calculated by two-sided Mann-Whitney U-tests with Benjamini & Hochberg corrections. b, mUC (IMVigor 210) (n=339) tumors. Neutrophil score 0 (n=227): minima: −2.67, maxima: 2.58, and Percentile 75%: 0.25, 50%: −0.34, 25%: −0.89. Neutrophil score 1 (n=39): minima: −1.06, maxima: 1.95, and Percentile 75%: 0.70, 50%: 0.18, 25%: −0.38. Neutrophil score 2 (n=33): minima: −0.63, maxima: 2.19, and Percentile 75%: 0.97, 50%: 0.50, 25%: 0.39. Neutrophil score 3 (n=40): minima: −0.99, maxima: 2.83, and Percentile 75%: 1.60, 50%: 1.27, 25%: 0.92. P values are calculated by two-sided Mann-Whitney U-tests with Benjamini & Hochberg corrections. Neutrophils were identified by trained pathologists based on their unique morphological features. Prevalence of neutrophils was graded on a scale from 0 to 3 as follows: 0 – absence of neutrophils, 1 – rare neutrophils, 2 – moderate number of neutrophils, 3 – numerous neutrophils in the form of large aggregates or sheets. c, Representative images of 22 out of a total of 59 samples examined (37%) showing positive signals of IL8 in situ hybridization (ISH; green signal, left panel) and H&E-stain (right panel) of sections from the same area of the specimen. ISH shows IL8 expression in tumor and myeloid cells; H&E shows neutrophils (yellow arrows) in the vicinity of IL8 expressing cells.

