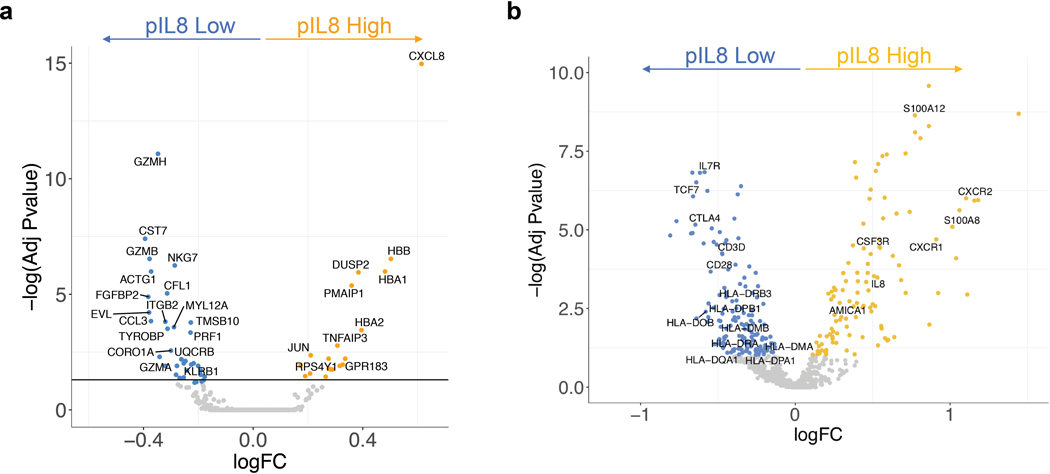
Extended Data Fig. 10. Differential gene expression in high and low pIL8 in CD8 T cell clusters and in PBMC from the entire IMvigor210 cohort.
a, Differential single cell RNAseq gene expression of CD8 T cell clusters from plasma IL8 high (n=5) vs low patients (n=5). Differential expression analysis with the generalized linear models (glm)-based statistical methods of the edgeR package with Benjamini & Hochberg corrections. b, Differential NanoString gene expression of plasma IL8 high vs low patients in IMvigor210 (n=407). Differential expression analysis with the generalized linear models (glm)-based statistical methods of the edgeR package with Benjamini & Hochberg corrections.

