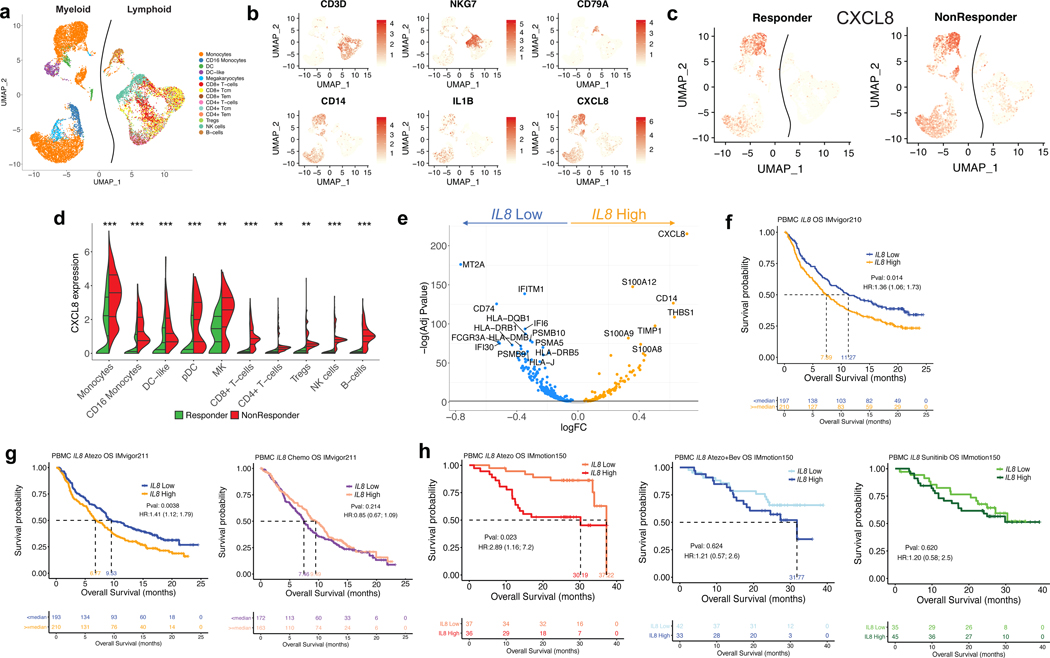
Figure 3. Poor clinical outcome and lower expression of antigen presentation genes associated with IL8-high myeloid subsets in PBMCs.
a, Different cell types showing subsets of distinct myeloid and lymphoid clusters, as revealed by single cell RNAseq of baseline peripheral blood mononuclear cells (PBMC) isolated from n=5 responders and n=5 nonresponders in mUC IMvigor210 cohort. Cell types were verified based on expression of the lymphocytic (upper panel) (n=6100) and myeloid (lower panel) (n=8374) cell type-specific markers shown in b. c, UMAP plot showing the expression of IL8 in all cell clusters in responders (n=7903) and non responders (n=5671). d, Split violin plot showing the expression of IL8 and cell numbers of different myeloid and lymphoid cell types between responders and nonresponders. (Two-sided Mann-Whitney U-tests with Benjamini & Hochberg corrections) ***FDR <0.001; **FDR<0.01. e, Differential expression of IL8 high vs low populations (by median of all myeloid cells) in combined myeloid clusters. Monocytes (n=6761), minima: 0, maxima: 7.87, and Percentile 75%: 5.37, 50%: 3.99, 25%: 2.83. CD16 Monocytes (n=623), minima: 0, maxima: 4.09, and Percentile 75%: 2.31, 50%: 1.53, 25%: 0.45. DC-like (n=305), minima: 0, maxima: 5.70, and Percentile 75%: 2.68, 50%: 1.60, 25%: 0.92. DC-like (n=391), minima: 0, maxima: 5.73, and Percentile 75%: 2.23, 50%: 1.75, 25%: 0.98. Megakaryocyte (n=294), minima: 0, maxima: 6.09, and Percentile 75%: 3.67, 50%: 2.86, 25%: 2.12. CD8+ T cells (n=565), minima: 0, maxima: 3.56, and Percentile 75%: 1.31, 50%: 2.73, 25%: 0.87. CD4+ T cells (n=443), minima: 0, maxima: 5.19, and Percentile 75%: 0.76, 50%: 0.63, 25%: 0.48. Tregs (n=238), minima: 0, maxima: 3.72, and Percentile 75%: 1.23, 50%: 1.07, 25%: 0.95. NK cells (n=1099), minima: 0, maxima: 3.80, and Percentile 75%: 1.56, 50%: 1.32, 25%: 1.16. B cells (n=387), minima: 0, maxima: 3.84, and Percentile 75%: 1.84, 50%: 1.36, 25%: 1.27. Differential gene expression analysis between IL8-high (n=4187) and -low (n=4187) myeloid cells showing enriched expression of myeloid inflammatory response genes (orange) in IL8 high myeloid cells versus higher expression of antigen presentation genes (blue) in IL8 low myeloid cells. Differential expression analysis with the generalized linear models (glm)-based statistical methods of the edgeR package with Benjamini & Hochberg corrections. f, Kaplan-Meier curves depict overall survival of IL8 expression in PBMC of IMvigor210 using median cutoff. High IL8 gene expression in PBMCs was significantly associated with worse OS in mUC IMvigor210 (HR: 1.36, 95% CI: 1.06, 1.73, P=0.014). g, Kaplan-Meier curves depict overall survival of IL8 expression in PBMC of IMvigor211 using median cutoff in atezolizumab and chemo arms, respectively. High IL8 gene expression in PBMCs was significantly associated with worse OS (HR: 1.41, 95% CI: 1.12, 1.79, P=0.0038) in atezolizumab arm, but not chemotherapy arm (HR: 0.85, 95% CI: 0.67, 1.09, P=0.214). h, Kaplan-Meier curves depict overall survival of IL8 expression in PBMC of IMmotion using median cutoff in atezolizumab, atezolizumab + bevacizumab and sunitinib arms. High IL8 gene expression in PBMCs was associated with worse OS in the atezolizumab arm (HR 2.89; 95% CI 1.16, 7.2, P=0.023) of mRCC patients in IMmotion150 but not in atezolizumab + bevacizumab (HR 1.21; 95% CI: 0.57, 2.6, P= 0.624) or sunitinib (HR: 1.20; 95% CI: 0.58, 2.5, P= 0.620) arms. HRs in Figure 3f-h were calculated using stratified Cox proportional hazard regression models, and P values were calculated using stratified log-rank test. P values were adjusted for multiple comparisons. Multivariate analyses adjusted HRs for age, sex, race, ECOG performance status, presence of liver metastasis, and tumor burden (sum of longest diameter, SLD) in mUC; age, sex, Memorial Sloan Kettering Cancer Risk (MSKCC) prognostic risk score, previous nephrectomy, and SLD in mRCC data sets.

